
 and Bitcoin Cash (BCH) Price Analysis")
Summary
After a promising start for cryptos in February, a bearish outlook has engulfed the charts. As the day began, most candlesticks showed red while investor sentiments took a dip. Despite the general bearish outlook in the markets, today’s focus coins have only dipped negligently, each registering less than a percentage point in the loss.
The slight drop had the effect of pushing the various Relative Strength Indexes (RSIs) from the undersold area into the medially sold region.
Bitcoin (BTC/USD)
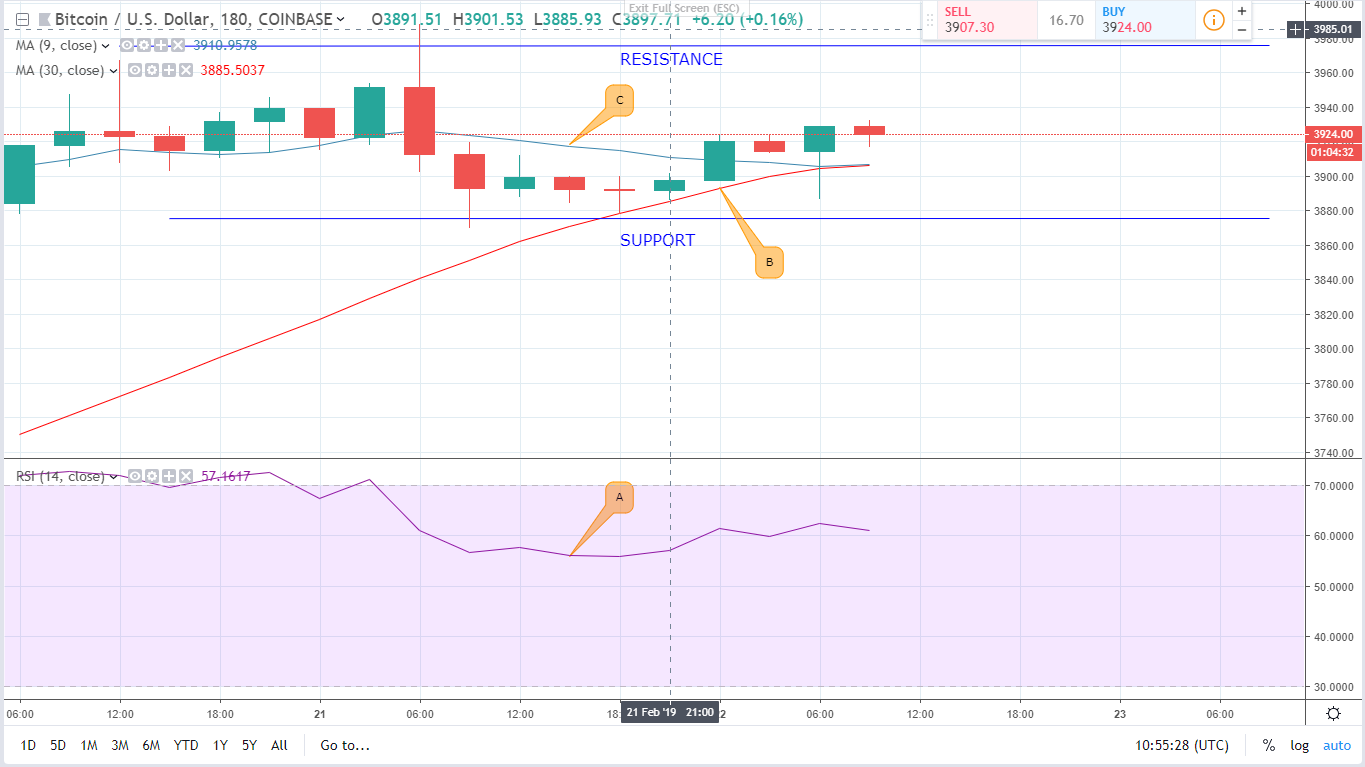
Bitcoin, the largest cryptocurrency by market capitalization, is down by less than a percentage point and struggling for the $4k mark, having started off the day selling at $3939 against the current rate of $3999. This is after the day began on a high note for investors who were at first reluctant to sell off their Bitcoin holdings in anticipation for better prices. As the day wore on however, the RSI (A) scale dropped as a bearish momentum took over.

The bearish trend was signaled by a contacting triangular pattern formed between the 9 day (C) and the 30 day (B) moving averages.
Despite the drop, a strong price consolidation towards the $4000 mark is slowly being achieved. At the moment, support has held at around the $3900 mark and Resistance above the psychological price zone of $4000.
Forecast
All indicators signal a bearish outlook in the near future. The 9 day EMA is facing south while the 30 day EMA is facing North and is about to cross over on top. This means that the price of Bitcoin is likely to go down.
Bitcoin Cash (BCH/USD)
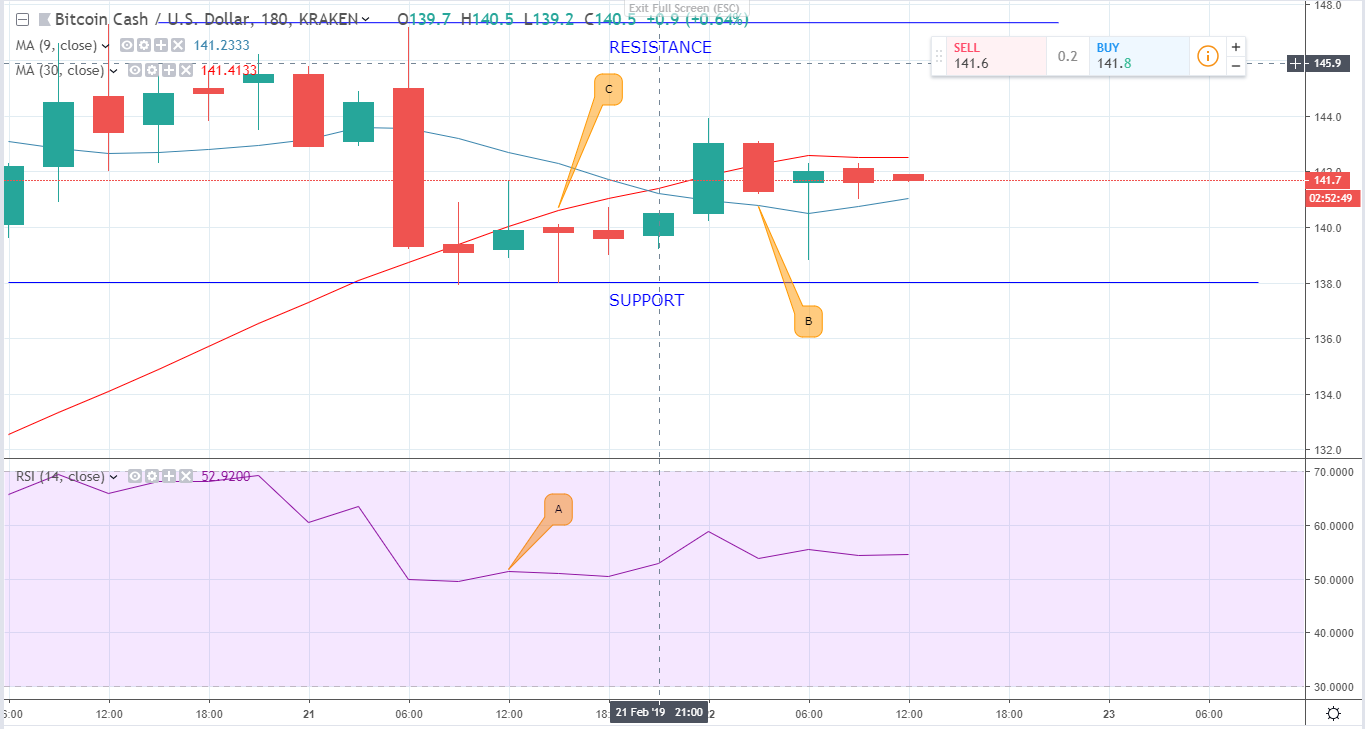
Due to its strong co-relation to Bitcoin, the technical analysis charts of Bitcoin Cash (BCH) are almost synonymous. Support has consolidated at a higher level than was the case a few days ago while Resistance has also been pushed further up.
In the markets, investor confidence dipped, coming from the ‘undersold’ area into the medially sold region. This is as indicated in the RSI (A).
Forecast
Over the last 24 hours, the 9 day (C) and the 30 day EMAs (B) have been moving towards each other in a contracting triangular pattern. The 30 day EMA is set to cross over above the 9 day EMA which shows that a Bearish outlook is incoming.


