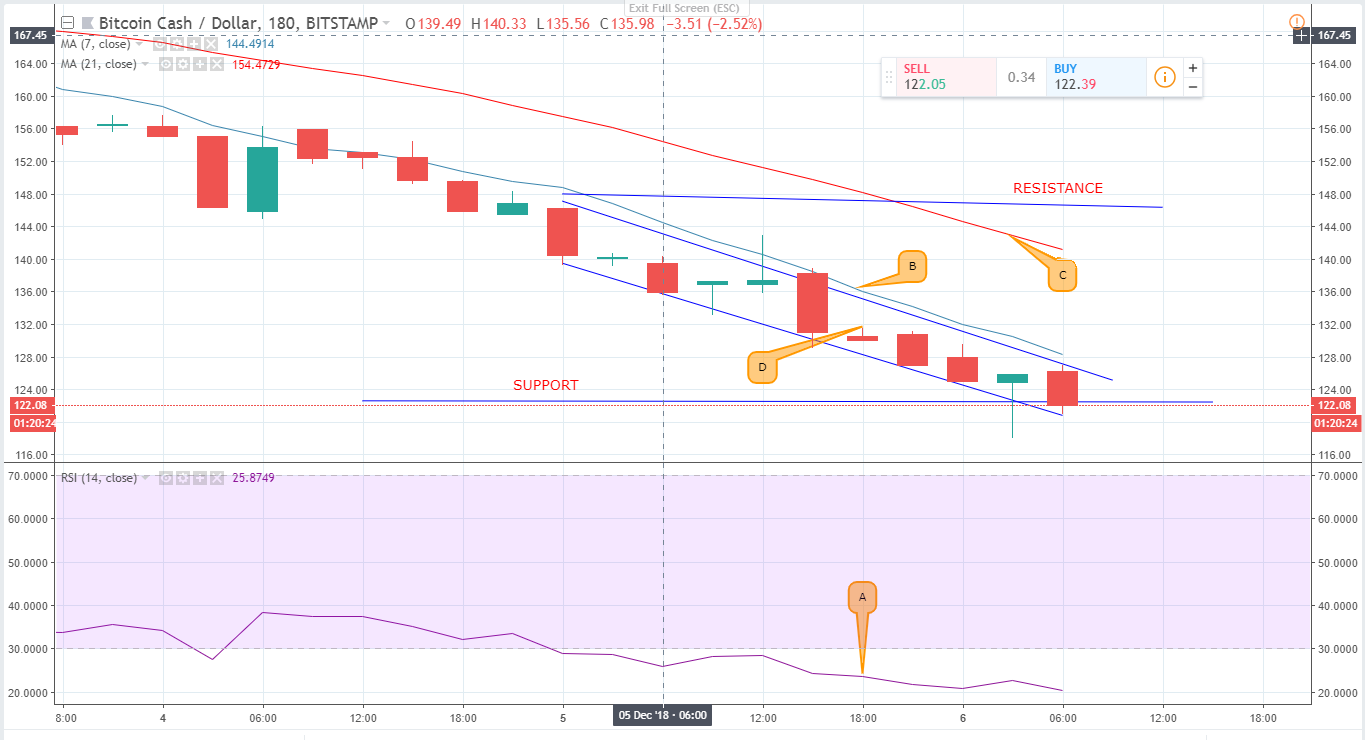
The markets continue to struggle with the Bears overpowering the Bulls yet again. Today, the bearish wave continues across most cryptos with Bitcoin still trading below the $4000 mark. Bitcoin Cash is still experiencing a hard time after the BCH Hard fork in November. The altcoin has lost 11.06% over the last 24 hours, with the bearish momentum expected to continue.
Bitcoin BTC/USD

Bitcoin, engulfed by a strong bearish wave, has continued to lose. Over the last 24 hours, it lost by about 5%, moving from $3982 yesterday to today’s $3756. The initial psychological price zone of $4000 has been tested and breached in the last few days.
A new support has been set at around $3750 as shown in the chart which goes to show the strong bullish momentum precipitated by November’s BCH hard fork. On the other hand, Resistance has been maintained at the $4000 zone which may take a lot of upward rallies to be breached.
However, investors’ sentiments have been positive as shown by the altcoin’s Relative Strength Index (RSI). Point A shows the RSI begin the day at 43 (middle zone). On the lower side, it came to 35 and is currently at 46. Investors are holding on to their coins as opposed to selling them.
There is a strong bearish momentum as can be seen on the moving averages. The 21 days EMA is above the 7 days moving average as seen in B and C. Also, the 21 days and the 7 day EMAs are wide apart indicating the bears may remain for some time.
Bitcoin Cash (BCH/USD)

On most exchanges, Bitcoin Cash has been on a downward spiral in the post-fork period. It has been losing by double-digit percentages due to the volatility effect that the hard fork brought about. Yesterday’s price level of $146 lost by 13.68%. Today, BCH is exchanging at $126.26 against the dollar. Yesterday’s price zone of $146 set the Resistance and support lay at around $122.49.
Investor confidence in Bitcoin cash also continues to diminish as can be seen in A. The RSI was at 29 yesterday before hitting a low of 21. Today, it is at 20. This shows that there is little confidence that Bitcoin cash will pick a Bullish momentum any time soon.
The bearish momentum has also been reflected in the 7 and 21 days EMAs as seen in C and B. The two moving averages are wide apart, forming a Descending Triangular pattern that signals a strong bearish trend.


