
 Technical Analysis For September")
Introduction
Today, we look into Credits (CS). A cryptocurrency that’s already trading on KuCoin, Gate.io, Bitfinex, and other exchanges. Check the list of exchanges here. Credits ICO was held on February 2018. Its price was 0.167 USD or 0.0002 ETH. At the current stage, the team is preparing for a token swap.
CS/ETH Daily Chart
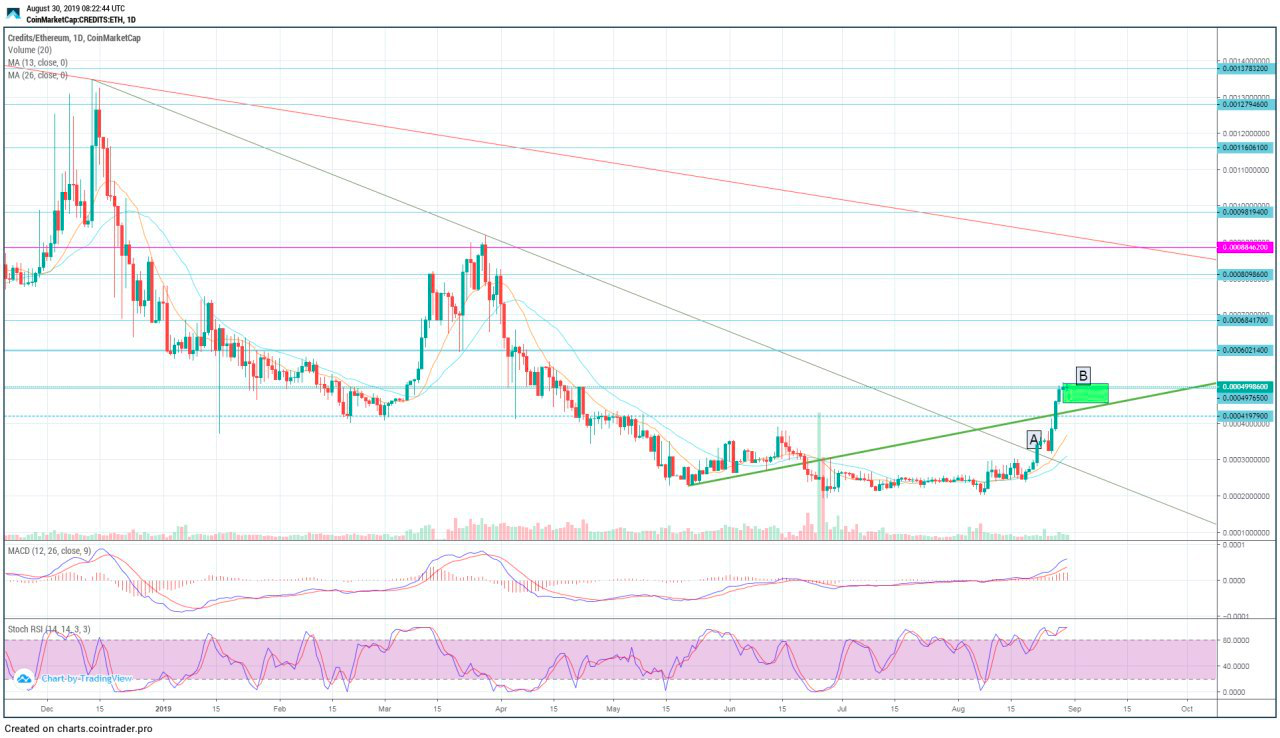
On the chart, we see that the price made a breakout of the downtrend line in 0.00030-0.00031 ETH (point A) and confirmed the breakout, returning to the trendline. After that, buyers’ interest is traced which leads to an increase in price by 67.9% (to point B). Currently, the coin is being traded in the interval of 0.00047-0.00048 ETH. The green zone shows the optimal zone for purchasing. The following resistance level is in the areas of 0.00081 ETH and 0.0008846 ETH and can be overcome with the next impulse wave.
CS/ETH 4H Chart
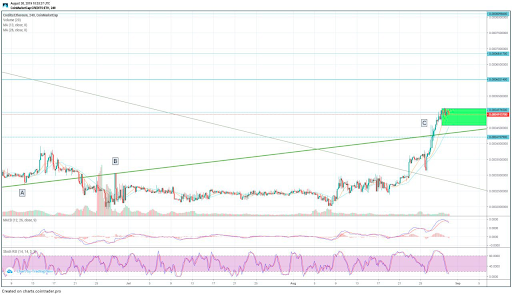
On this chart, in point A we can see the touch of the support line, which was broken out at 0.00029 ETH. At point B, buyers tested the line again, but the seller was stronger. After a long period of accumulation of positions, buyers confidently overcame the resistance level at the level of 0.00042 (point C) and consolidated above the level of 0.00048 ETH. RSI is in the bottom zone, which is a strong bullish signal. At the moment, we see a continuation of the uptrend, the green zone shows the optimal zone for purchases. The next support area on the 4H timeframe is 0.00060 ETH.

CS/BTC 4H Chart
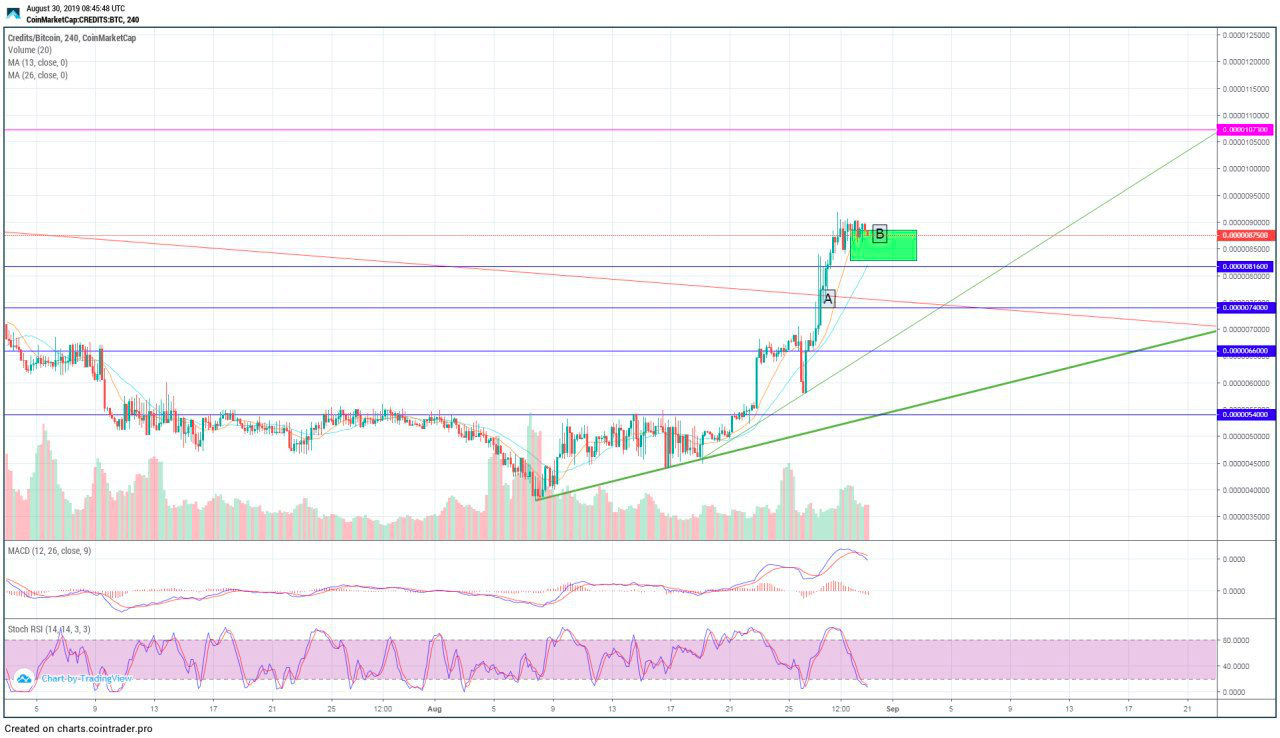
On this chart, we see that the price has passed 5 resistance levels. There was an entrance from the flat-top triangle in the 540 Satoshi area. The level of 660 Satoshi was protected by the seller, but buyers were stronger and passed this zone. The next resistance zones of 740 Satoshi and 816 Satoshi was broken fast as well. As a result of this impulse, the most important resistance level – downtrend line, at point A, was broken, setting a local uptrend. Now, RSI is in the oversold zone, which is a strong buy signal. The fact that the price did not give a strong pullback confirms the interest of buyers. Point B shows the area for buyers to take a position. The next resistance zone is 1073 Satoshi, 1326 Satoshi, and 1567 Satoshi, which can be reached with the next impulse wave.
Conclusion
This technical analysis of the CS coin is optimal in terms of the risk/profit ratio. The information given in this article expresses a subjective opinion and does not promise profit.
Disclosure: The ZyCrypto News Department Was Not Involved In The Production Of This Content.

