

Bitcoin is currently trading at around $8,140 after a huge break above $7,792 and eventually $8,000 with a lot of continuation. The bulls have managed to break through a crucial resistance level and if they manage to close the day above $8,000, they will remain gratified.
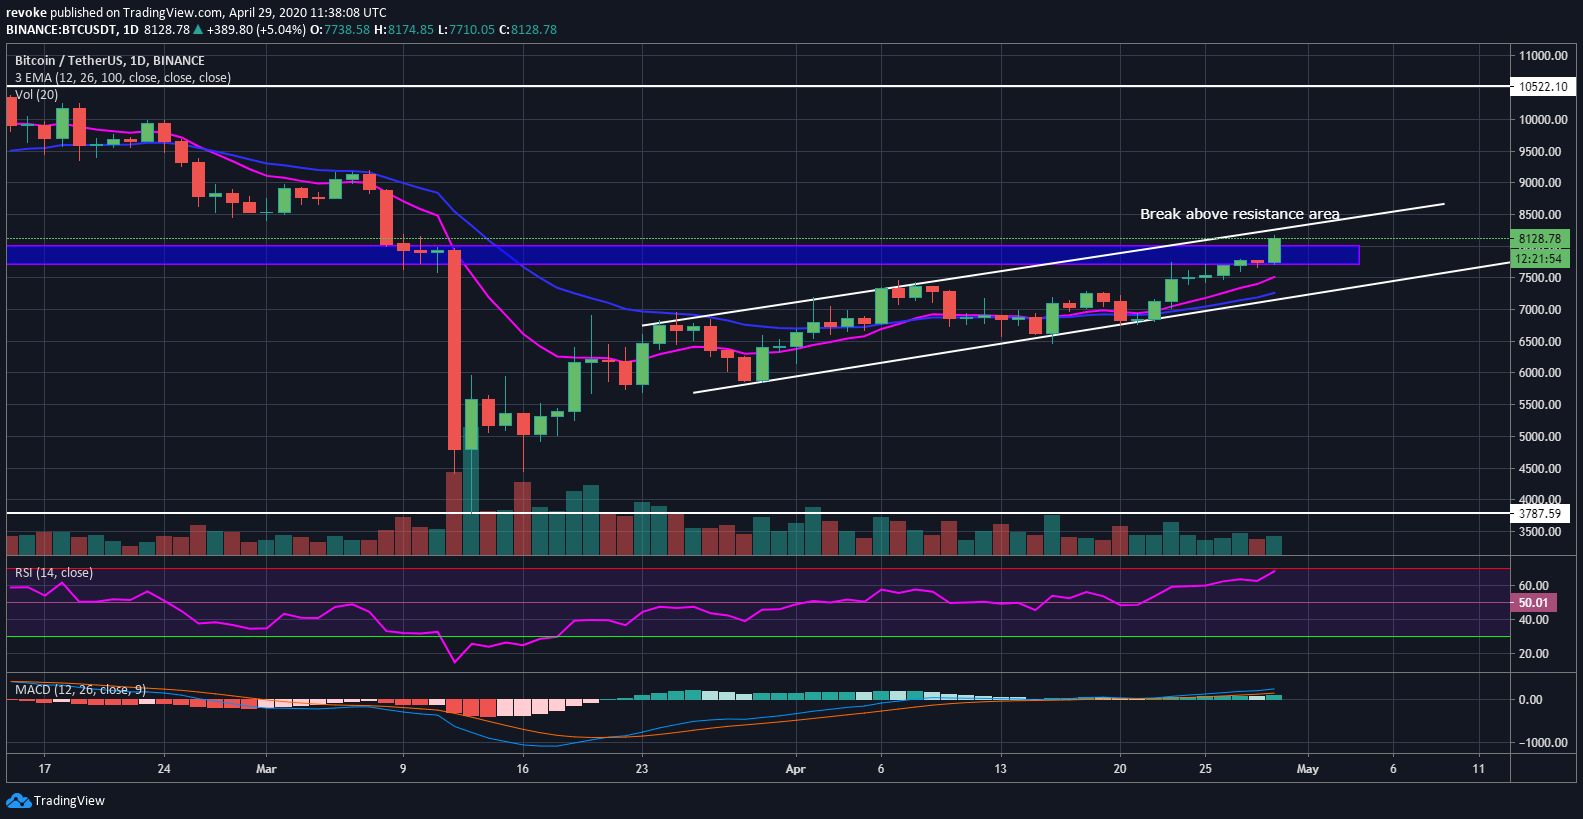
Surprisingly, there hasn’t been a spike in trading volume but the day has just started. The bulls are now looking at basically no resistance until $9,000. The daily RSI is on the verge of a cross to the overbought zone, however, considering the momentum of the bulls, it’s unlikely that this indicator will play an important role in the near future.
Is The Halving Bull Run Finally Here?
It’s clear at this point that Bitcoin and the entire crypto market have recovered far better than the traditional stock market which is still trading sideways. Bitcoin has decoupled from the S&P500 and it’s currently trading at levels seen before the crash.

Obviously, the daily chart is in a strong uptrend but what about the longer time frames? Let’s look at the weekly chart for a moment. Clearly, the bulls are in control but have not changed the weekly downtrend just yet. At this point, we have seen 7 weeks of positive gains for Bitcoin but the bulls still need to break above $10,500 to change the trend.
The alternative is to set a lower high followed by a higher low compared to the bottom at $3,700. In the weekly chart, it is very clear how the trading volume has decreased over the past 8 weeks.

A crucial indicator here is the MACD which is on the verge of a bullish cross, the last bull cross propelled Bitcoin up to $10,500. The RSI is only at around 50 points and the EMAs are starting to look for a bull cross within the next few weeks. Bitcoin is currently trading above both the 12 and 26-period EMAs.
The monthly chart is fairly similar and definitely in favor of the bulls right now even though it is still in a downtrend. The MACD here is not a very good indicator and seems to be lagging a lot. The RSI is currently at 53 points but it’s unlikely to play an important factor until months ahead.


