
 Price Analysis: Serious Bull/Bear Battle")
Resistance levels: $5,119, $5,419 $5,858
Support levels: $4,636, $4,286 $3,868
BTC/USD Medium-term Trend: Ranging

The cryptocurrency is consolidating on the 4-Hour chart. There was a long bearish trend in the BTC market started on November 19, in which its low was found at $4,636 support level. The downtrend was interrupted by the bulls with the formation of a bullish engulfing candle at the demand level of $4,636 which return the BTC price towards $5,119 resistance level. The bearish inside bar candle returned the price to the consolidation phase.
The coin is consolidating on the support level of $4,636 below the 21-day EMA and 50-day EMA that are fanned apart which connotes that the bearish trend is ongoing. However, the MACD with its histogram is on the zero level and its signal lines interlocked at the oversold region which indicates consolidation in the BTC market.

The BTC price will either break to the north or to the south of the market. In case it breaks out to the south, the downtrend will continue and its low may be found at the support level of $3,868. If the bulls defend the support level of $4,636 and the price break to the north BTC will have its target at the resistance level of $5,419.
BTCUSD Short-term Trend: Ranging
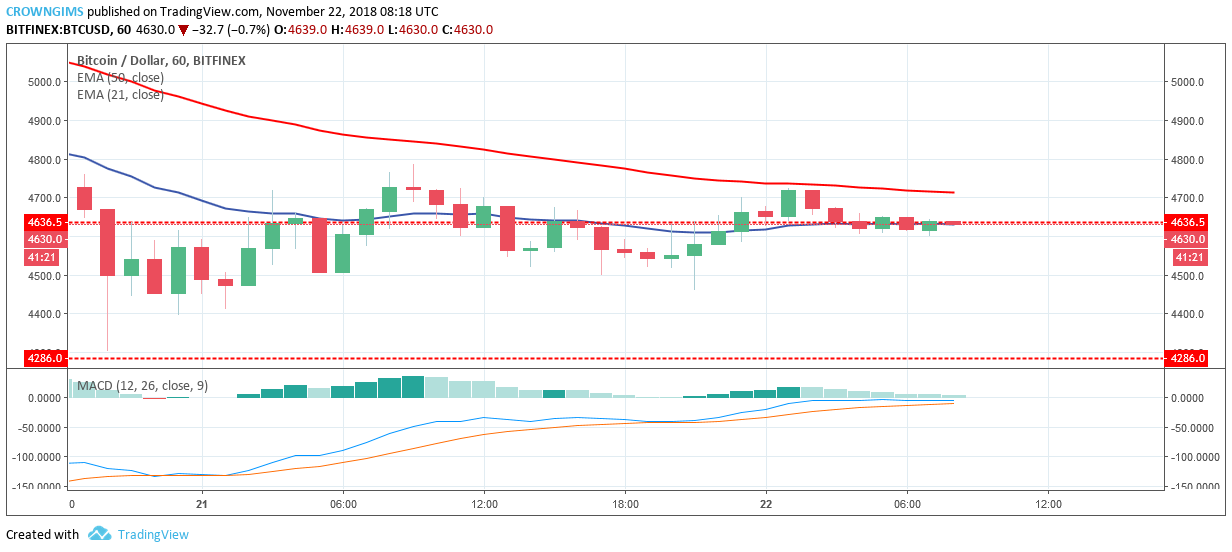
On the 1-Hour chart, BTC is ranging. BTC started sideways movement after it dropped down to the low of $4,286 price level where the bulls rejected the bearish movement. The sideways movement flips around the support level of $4,636.
The coin is in between the 21-day EMA and 50-day EMA and the two EMAs parallel to each other indicate that consolidation is ongoing. The MACD period 12, with its histogram on zero level and its signal lines parallel on zero level, connotes consolidation signal.
 Long Positions at All-Time High Yet Price Remains Stagnant")
, and Stellar (XLM) Price Analysis – Recovery Expected Above Major Support Levels")
 and Stellar (XLM) Weekly Price Performance Overview")