
 Price Watch October 30")
BTC/USD Medium-term Trend: Bearish
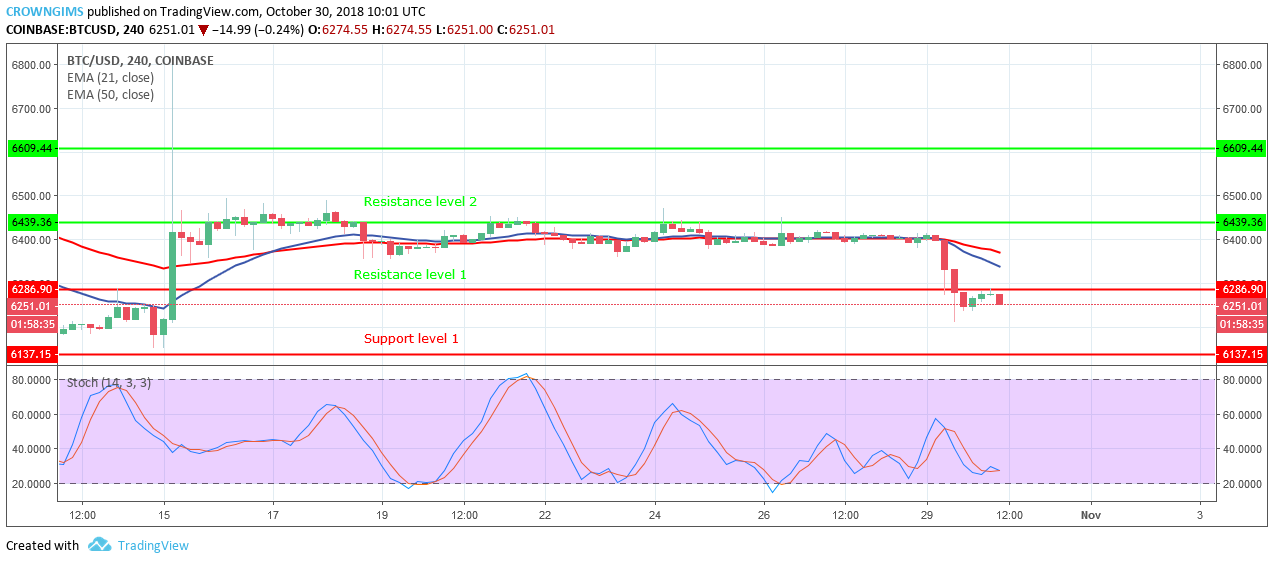
Resistance levels: $6,286, $6,439, $6,609
Support levels: $6,137, $6,030, $5,900
The BTCUSD pair was in a bearish trend yesterday.
Before the bearish trend, the price of Bitcoin had been range bound between the levels of $6,439 and $6,286 in the last twelve days. It was at this range bound zone that the Bears pulled back the BTC price to the lower level of the range.
Bulls had lost pressure and the bears took control of the market by broken downside the yesterday support level of $6,286 with strong bearish candles. The coin has been exposed to the support level of $6,137.
Today, the cryptocurrency is fluctuating below the resistance level of $6,286.The gravestone doji candle formed followed by bearish candle indicates that the downtrend movement will continue towards the support level of $6,137. If the price breaks this level, there are indications that it will find its low at the $6,030 and $5,900 support levels.
If the bulls defend this zone and the price bounces back, traders may initiate long trades and stop-loss orders below the $5,900 price level. You can exit your long trades at the resistance of $6,286 or when the price reverses.

On the other hand, if the lower level of $6,137 price holds, the BTC price will attempt to reach the high of the $6,609 price level. However, Stochastic Oscillator is above 20 levels with its signal lines point down, which indicates a sell signal.
The Bitcoin price is below the 21-day EMA and 50-day EMA which indicates that the price is falling.
BTC/USD Short-term Trend: Bearish
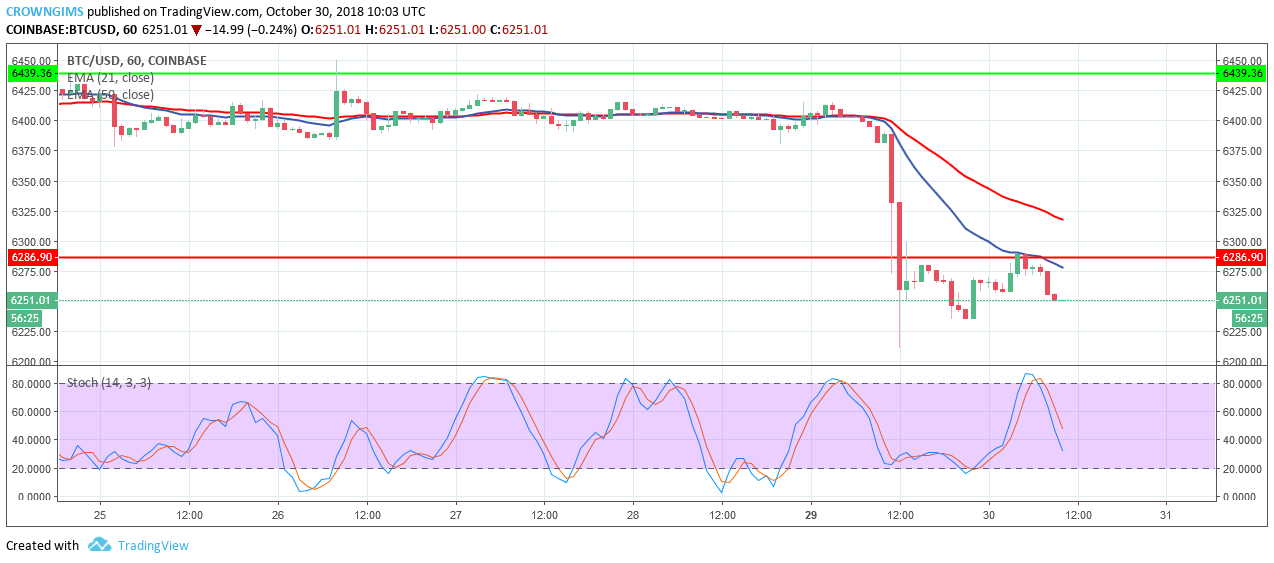
On the 1-hour chart, the BTC price is in a bearish trend. The BTC price fell to the low of yesterday support level of $6,286 and broke the level downside. The support level of $6,137 has been exposed.
Today, the coin has carried out retracement to the resistance level of $6,286. Meanwhile, the Stochastic Oscillator period 14 is at level 40 with the signal line point to the south which indicates that the market is selling and the bears will still hold the market.


