
![Bitcoin [BTC] Price Analysis: Will the Bears break down side of $6,286?](https://zycrypto.com/wp-content/uploads/2018/11/Bitcoin-BTC-Price-Analysis-Will-the-Bears-break-down-side-of-6286.png "Bitcoin [BTC] Price Analysis Will the Bears break down side of $6,286")
BTCUSD Medium-term Trend: Bearish
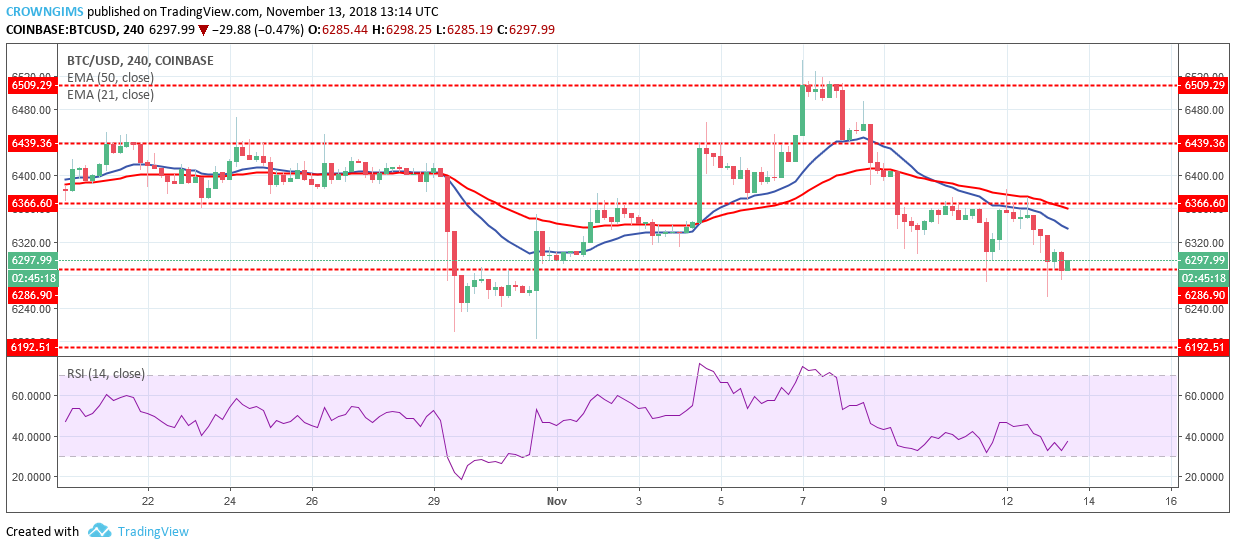
Resistance levels: $6,366, $6,439, $6,509
Support levels: $6,286, $6,192, $6,092
The coin is in bearish trend on medium-term outlook. The bears returned to the BTC market with full force on November 8 after the BTC price reached its high of $6509 price level by the bulls’ pressure. Short consolidation was observed before the bears took over with the strong massive bearish candles that led to the broken downside of former support levels of $6,439, $6,366 to the support level of $6,286.
Today, the BTC price is on the support level of $6,286 in which if the bears can maintain their momentum or increase their pressure the support level will be broken and expose the support level of $6,192.

In case the support level of $6,286 holds and the price bounce up the bulls may take over. Meanwhile, BTC price is below the 21-day EMA and 50-day EMA with distance from EMAs indicate the bearish trend is ongoing. The RSI is above 30 levels with signal line points up which may be the pullback of the bearish trend.
BTCUSD Short-term Trend: Bearish
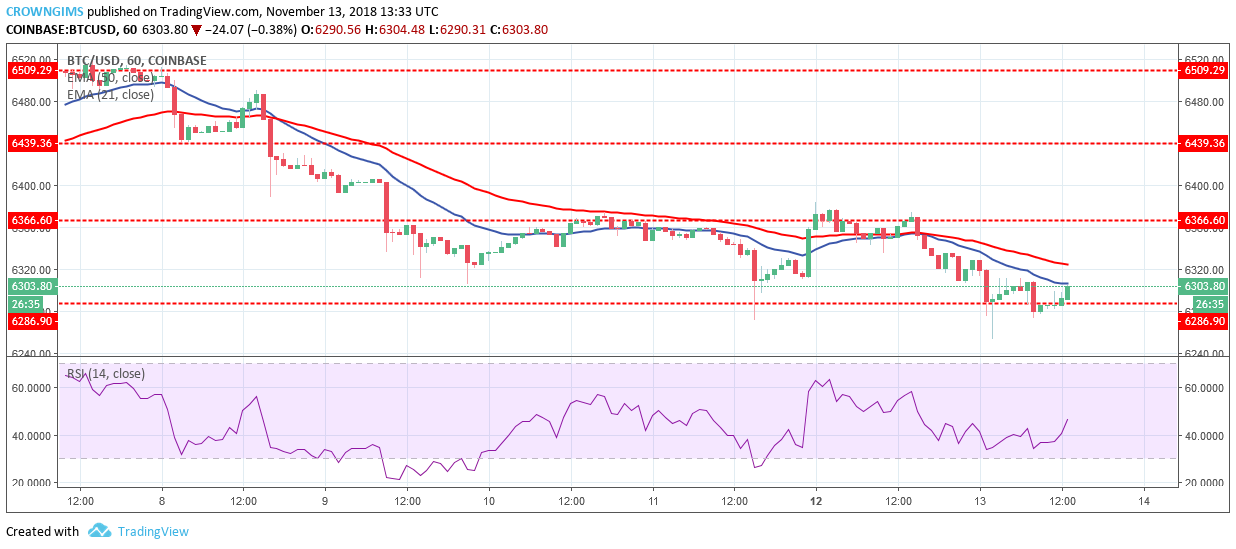
The coin broke out from the consolidation that occurred at the resistance level of $6,366. Bearish engulfing candle formed at the resistance level gave an insight that the bears are in control with increased pressure. The bears’ pressure broke downside the support level of $6,286 which was rejected by the bulls resulted in the formation of bullish pin bar that returns the price above $6,286 price level.
BTC price is below the two EMAs indicating a bearish trend but the RSI is above level 14 with its signal line pointing up which is a buying signal, it may be a pullback. Traders are advised not to trade against the trend.
 Long Positions at All-Time High Yet Price Remains Stagnant")

