

Summary
Investor sentiments on the cryptocurrency markets are positive despite a bearish rally that lasted a few days towards the end of February. The dip was tied to Bitcoin’s inability to break past the $4000 mark on Sunday. The dip was occasioned by buyouts which led the various coins to be oversold thus creating a bearish rally. In the last 24 hours, however, there has been an upward rally towards a price reversal.
Previously held support levels have been bettered while resistance zones have been tested and breached in some instances. In the markets, investor sentiments are steady with the coins attaining price consolidation. Today’s focus coins performed as follows:
Bitcoin Cash (BCH)
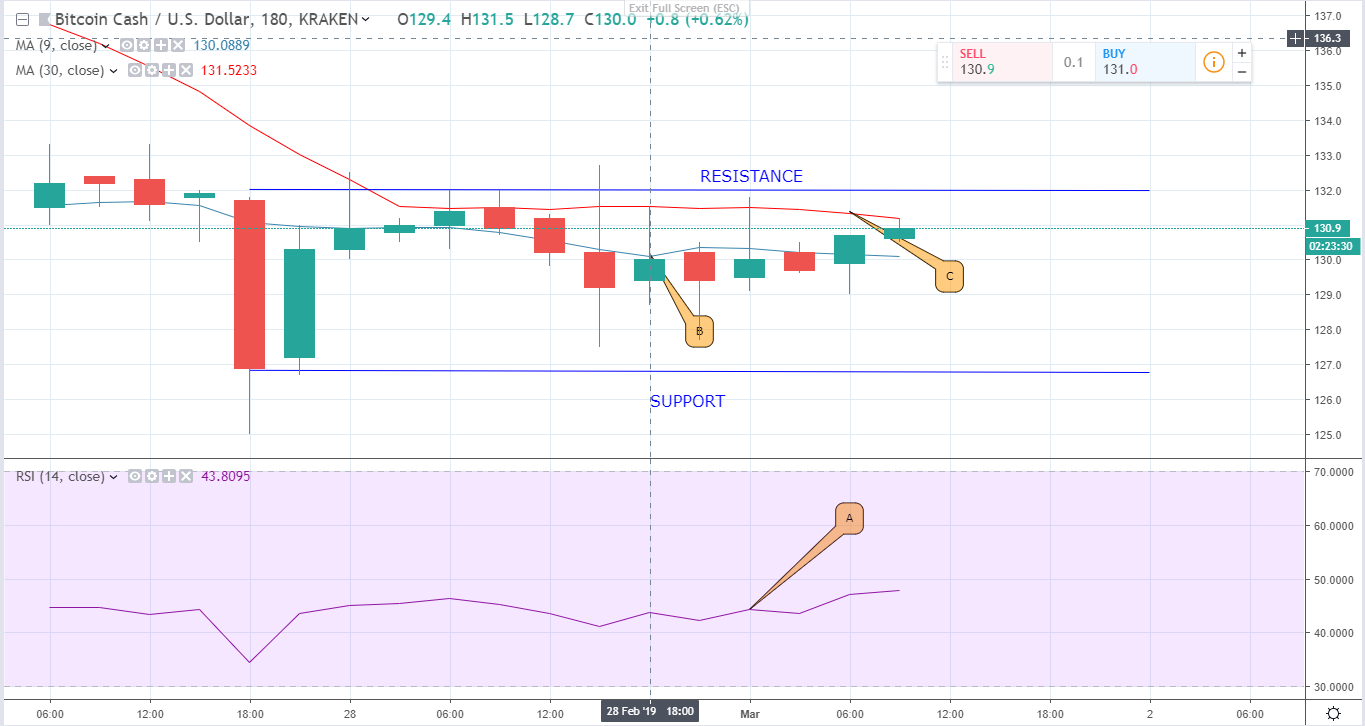
Bitcoin Cash is up by 1 percentage point. This is after it opened trade at $130.3 and is at $130.8 as at 0900h on March 1. This upward movement has seen its previous support zone, set at $126.9 up to $129.2. This is an indicator of a bullish rally in the coming days. Also, the $132.2 resistance zone was tested and breached twice during the day.

In the markets, investor sentiments are steady seeing that the RSI (A) is headed up.
Forecast
At the moment, the 30 day EMA (C) is headed down and seems set to cross below the 9 day EMA (B) in a contracting triangular pattern. This signals an uptrend.
Litecoin (LTC)
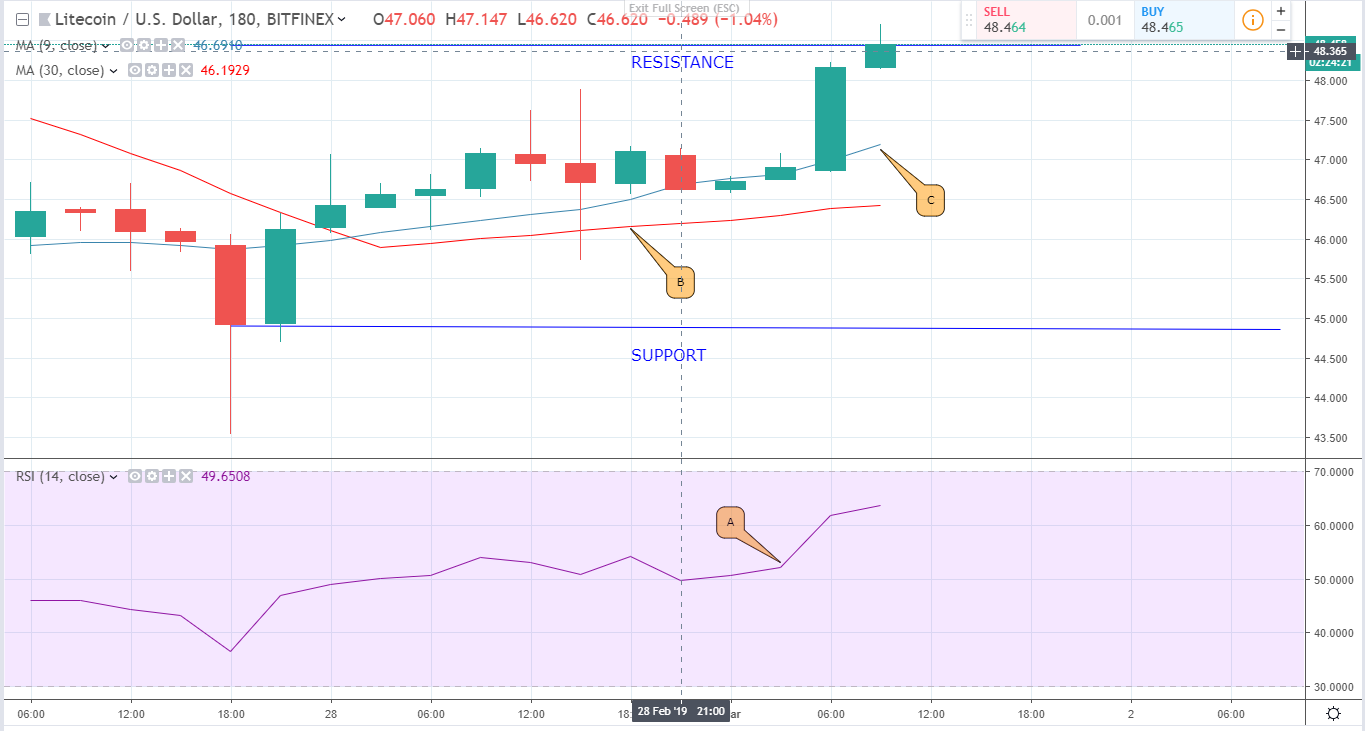
The LTC/USD pair has overcome a bearish momentum to register a 7.7% increase in its price. This is after it began trading at $46.14 on February 28 to $48.17 as at 0900h on March 1. This has led to a new support zone at $46.5, up from yesterday’s $44. On the other hand, yesterday’s resistance level was tested and breached which signals an upward price movement.
In the markets, the coin is increasingly becoming undersold as indicated in the RSI (A). This means that investors are upbeat of better prices.
Forecast
The 9 day EMA (C) has been dominantly above the 30 day EMA (B) with the two forming a reverse contracting triangular pattern. This shows that a Bull Run is in the offing.
Cardano (ADA)
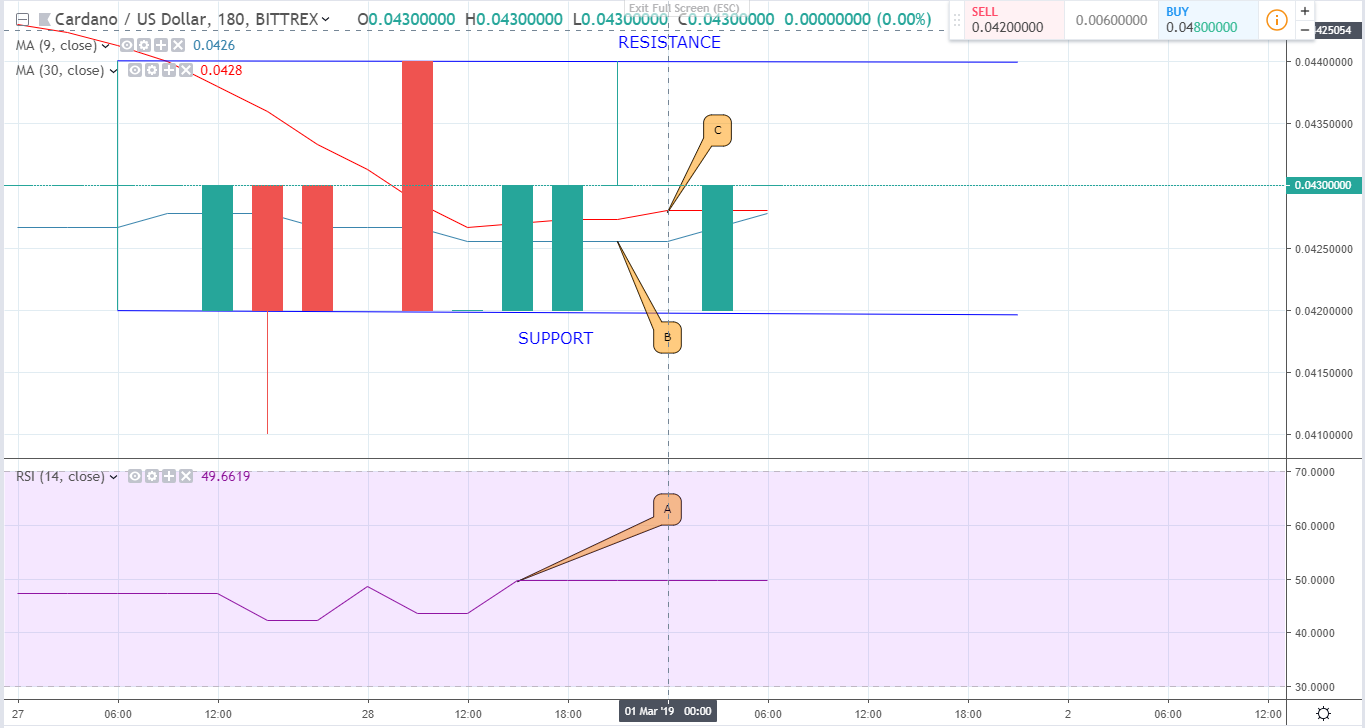
The ADA/USD pair has had very little activity in the last few days. It is currently selling at $0.043221 and is down by 0.88% in the last 24 hours. There has been no attempt to better its support nor to test its resistance zone.
In the markets, the coin is steady, neither oversold nor under bought as seen in the RSI (A). In the last 24 hours, it sold $21 Million and has a total market capitalization of $1 Billion.
Forecast
The 9 day EMA (B) is crossing above the 30 day EMA (C) which signals a Bull Run in the coming days.


