

XRP had an 11.2% retracement since last week’s high of $0.30251. Currently trading at $0.257, the 3rd largest cryptocurrency by market cap remains one of the top coins that has not exceeded its yearly high before the wide-market crash on the 12th of March at $0.34676. Still, it appears some indicators are pointing to more upsides in the future.
According to data from analytics firm Santiment, despite the retracement from last week, the active address output for the 3rd largest cryptocurrency has remained high.
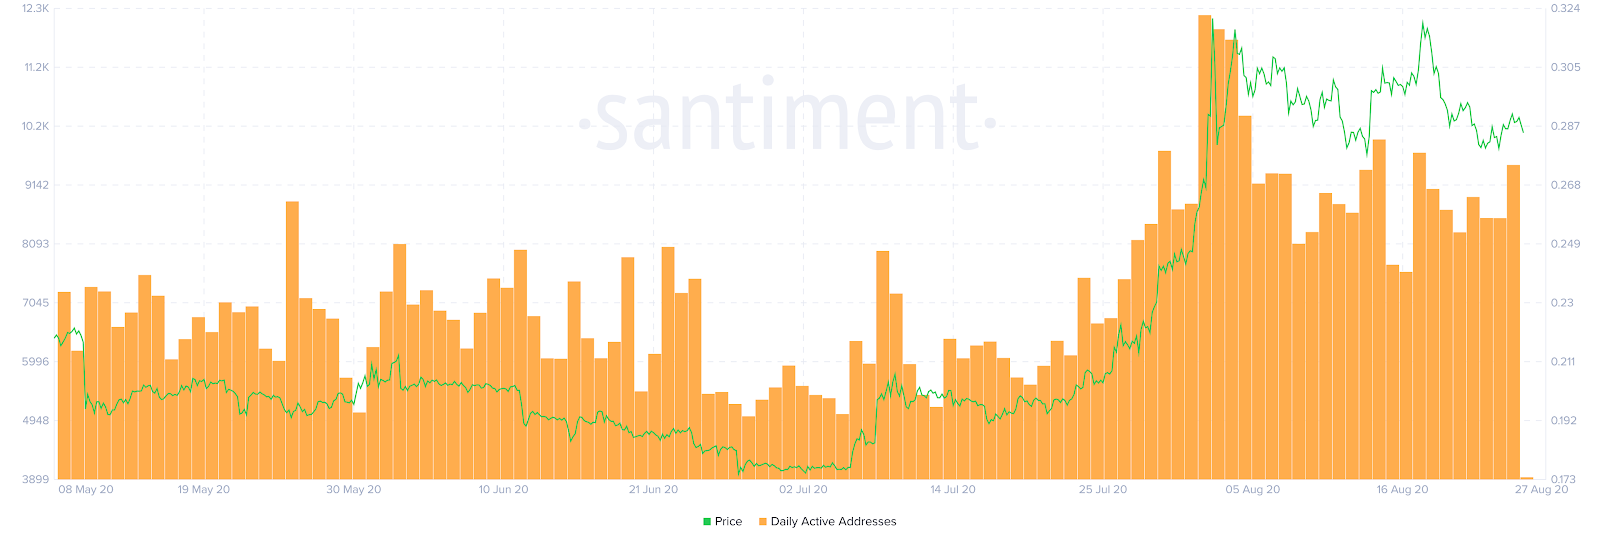
The data from Santiment, pictured above, showed the increase in the number of active addresses just as the price of XRP began to appreciate on July 27. Incidentally, that was also the day Bitcoin plowed past $10,000. The analytics firm called this a bullish divergence between the Daily Active Addresses and the Price. Starting Aug. 23, the daily active addresses started to increase while the price plunged, Santiment said this is a bullish divergence and theoretically, bullish divergences would signal a rapid price appreciation.
At the moment, this is XRP’s daily chart:
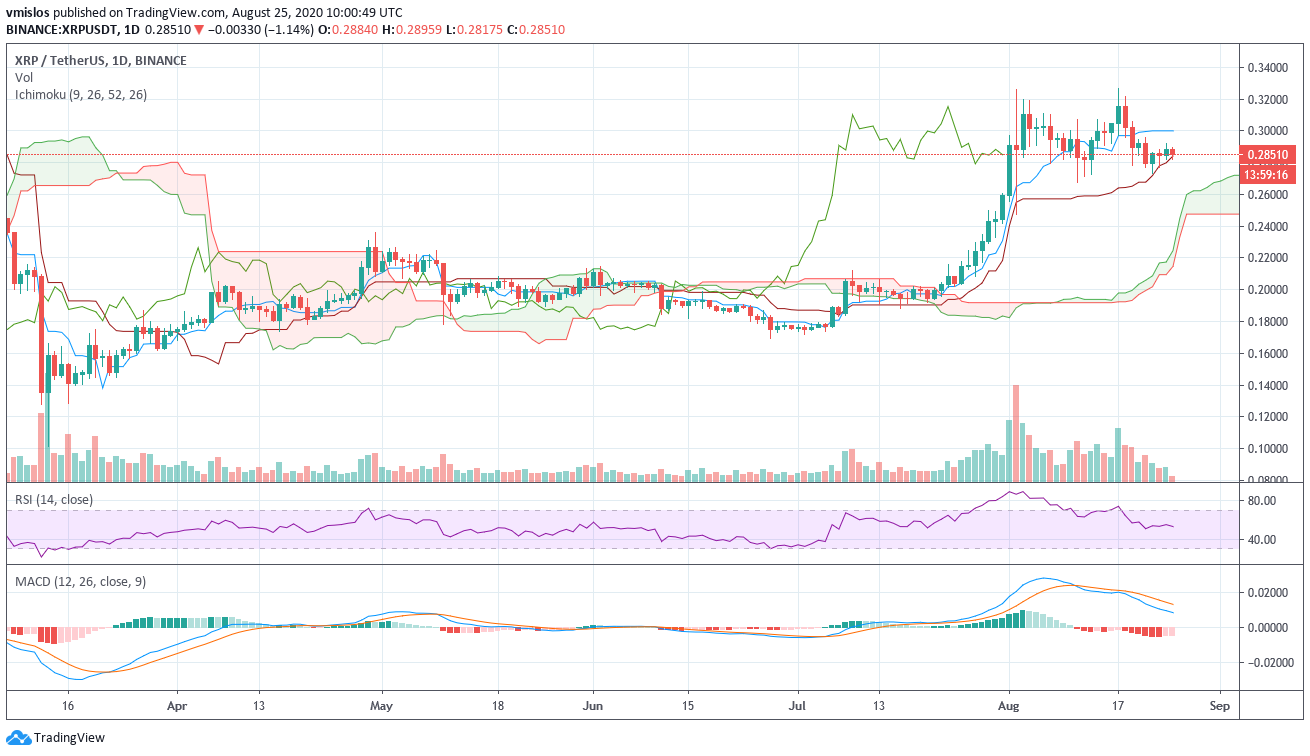
By late July, strong volume allowed XRP to finally rise above the Ichimoku Cloud. The upside, however, was met with selling pressure on the $0.31 level. Still, there is comfort on the fact that it is still above the clouds and the red line (base line) while the RSI is roughly on the same level as before the upside happened.

The below weekly chart paints an optimistic picture:
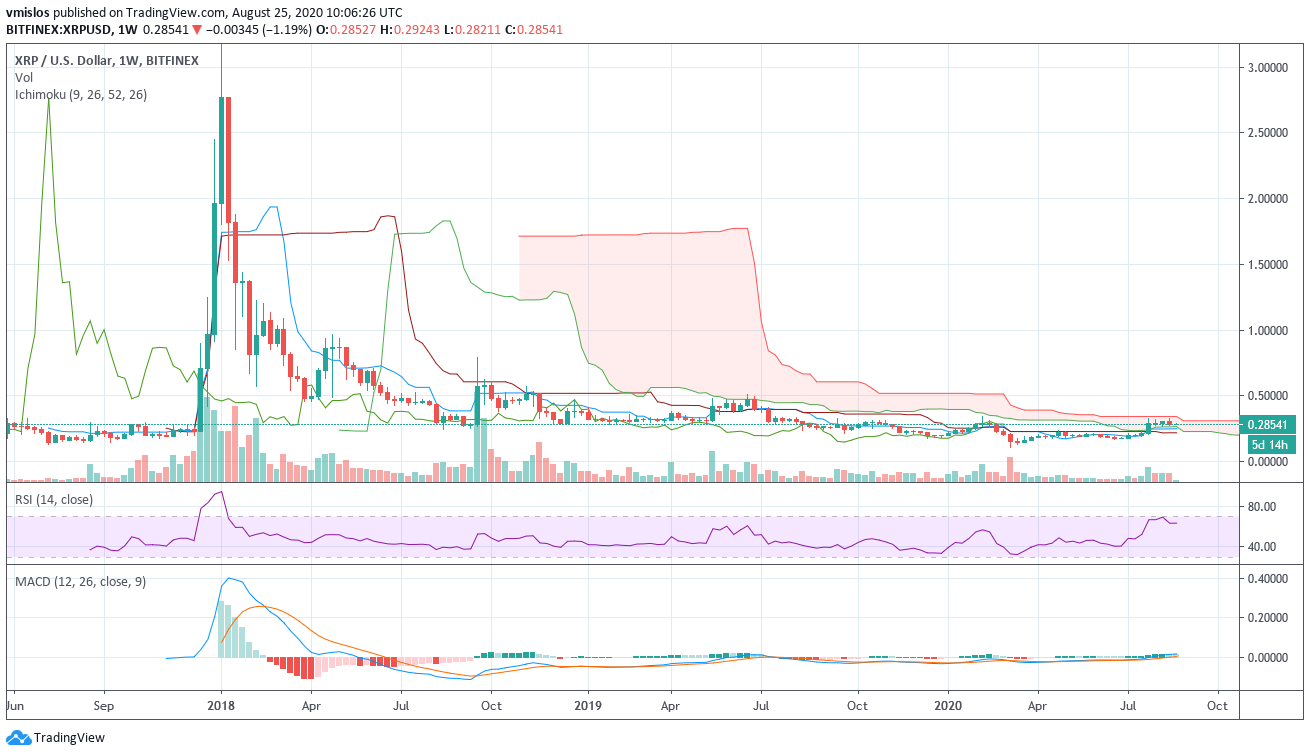
On Bitfinex, it is clear that XRP is way below the FOMO levels of 2018. Hodlers could take solace in the fact that it’s almost about to rise above the mists. In other exchanges, the volume has also picked up for XRP.
The monthly chart could be very dismal if you got in at steep prices, but it shows XRP could be months away from going above the baseline while the MACD has just recently indicated a bullish signal.
Of course, past price action would not always be an indicator of what would happen in the future, but the charts above, including the data from Santiment, showed there are signs for more potential upsides for the 3rd largest cryptocurrency, albeit probably not in the levels the 2018 hodlers expect.


