

Ripple – XRPUSD

Ripple (XRP) is still weak even after the recent overall crypto bounce that happened 2 days ago. The daily chart is still in a rough downtrend and the bulls were only able to see 2-3% gains over the last 2 days.
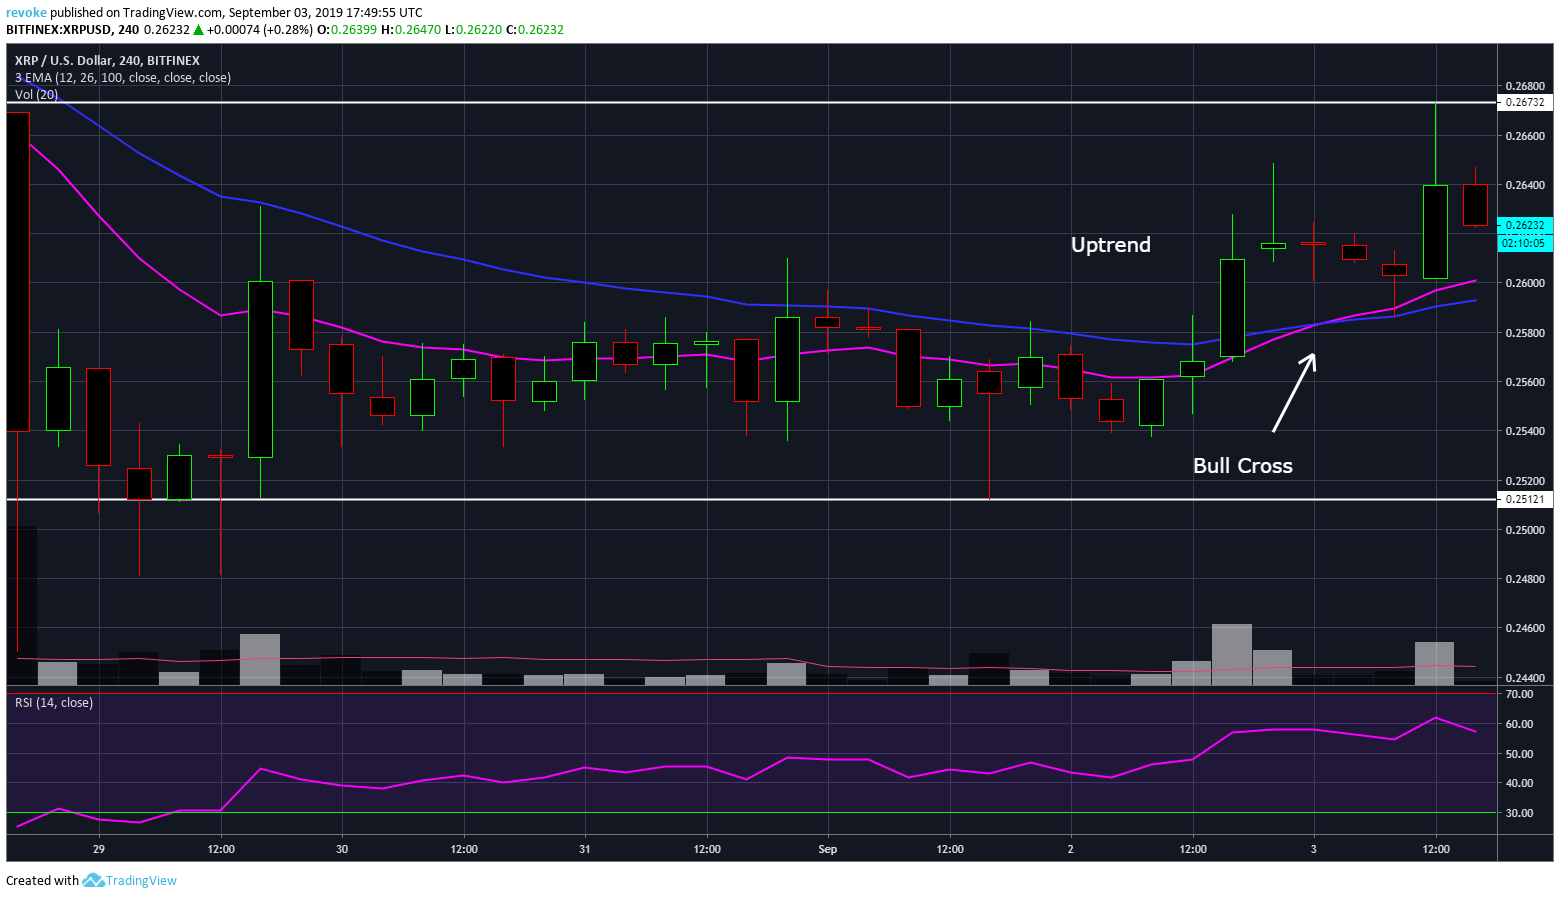
XRP is currently trading at $0.263 and the bulls would need to break above the daily resistance of $0.2796 in order to change the trend.
The 4-hour chart is looking much better and it’s now in a confirmed uptrend and the bulls are enjoying a decent amount of volume. The EMA’s have crossed bullish and XRP is currently trading above both of them.
The weekly chart hasn’t changed much and the bulls would need a lot of work and momentum to change the trend in the short term.
Stellar – XLMUSD
Stellar (XLM) is one of the weakest cryptocurrencies, currently trading at $0.063. The recent bounce was basically non-existent for XLM and the daily trend is still in a pretty rough downtrend. The setup was pointing towards a bear flag, however, the flag is now almost at the same size as the pole which means the pattern is no longer active.

The 4-hour chart is in a small uptrend but the bulls have to be careful since the volume isn’t too great. The EMA’s are also looking for a bullish cross within the next 12 hours. There is also really no resistance until $0.0685 which means that the bulls can easily push XLM up to that resistance level.
The weekly chart continues in a downtrend after 6 weeks in a row of negative gains. The current price is the lowest ever registered on Binance since it was listed back in May 2018.
Cardano – ADAUSD
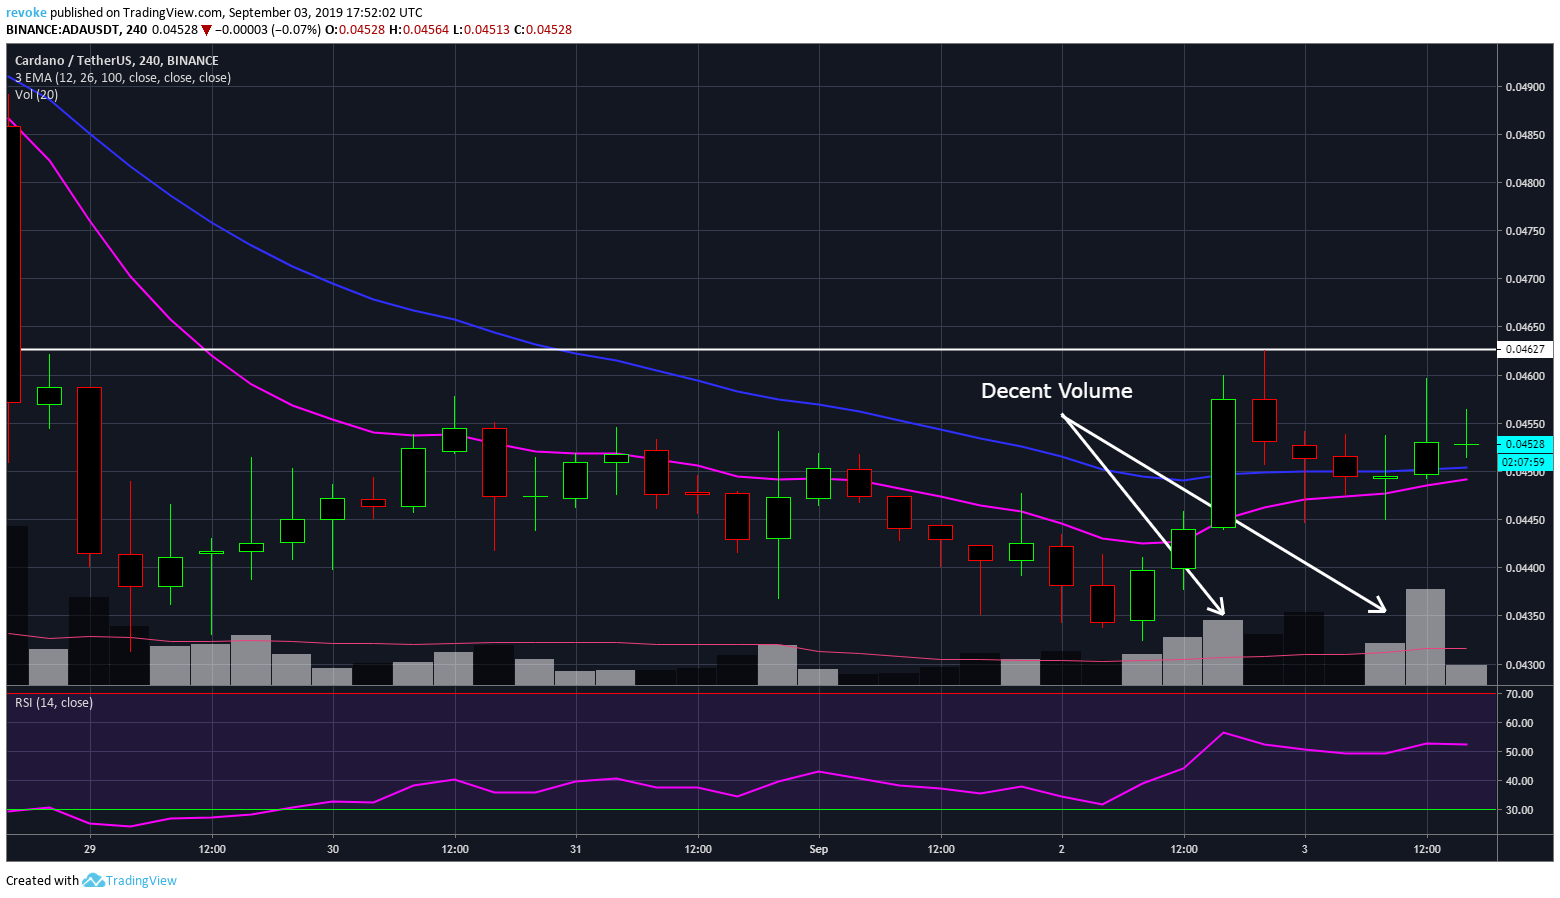
Cardano (ADA) is in a similar situation. The bulls weren’t able to take advantage of the recent bounce and the daily downtrend continues being strong. ADA is currently trading at $0.045 below both EMA’s.
The 4-hour chart looks a little bit better and the bulls are looking for a bullish cross of the EMA’s. The 4-hour chart is currently in a confirmed uptrend and the RSI is not yet overextended which means that the bulls still have a lot of room for improvement. There isn’t really any nearby resistance until $0.0504.
The weekly chart, clearly, still in a massive downtrend. The bulls have attempted several times to create hammer reversal candlesticks but saw no continuation every single time.

