

XRP/USD Medium-term Trend: Bearish
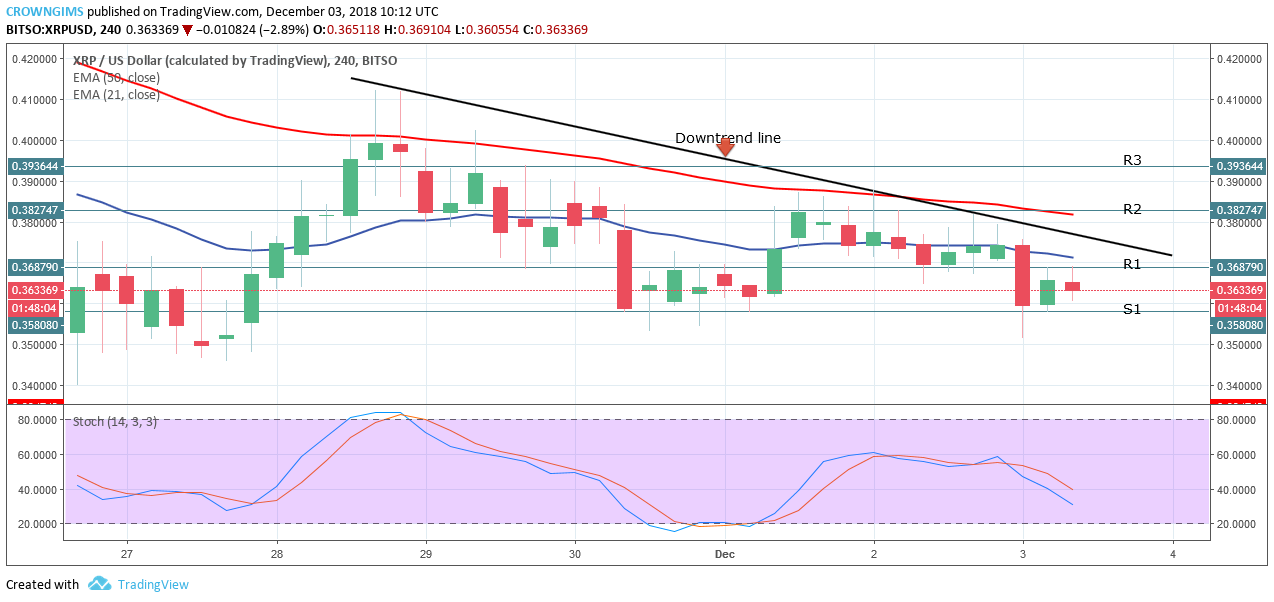
Resistance Levels: $0.36, $0.38, $ 0.39
Support Levels: $0.35, $0.33, $0.32
XRP is bearish on the medium-term outlook. After short consolidation, on December 01, the bulls pushed the coin up and broke the resistance levels of $0.36 and $0.38 but was rejected at the dynamic resistance of 50-EMA. Several attempts were made by the bulls to push and breakout above the second resistance level of $0.38 but were opposed by the bears.
Until there is a strong bullish candle break out and close above the drawn trend line bearish trend remains. XRP price is trading below 21-day EMA and 50-day EMA which indicates bears’ pressure. The Stochastic Oscillator period 14 is at the level 40 with its signal lines pointing to the south which connotes sell signal. Long positions may be advisable in case of a clear breakout above the resistance level of $0.36 with a strong bullish candle followed by a correction to it.

XRP/USD Short-term Trend: Bearish
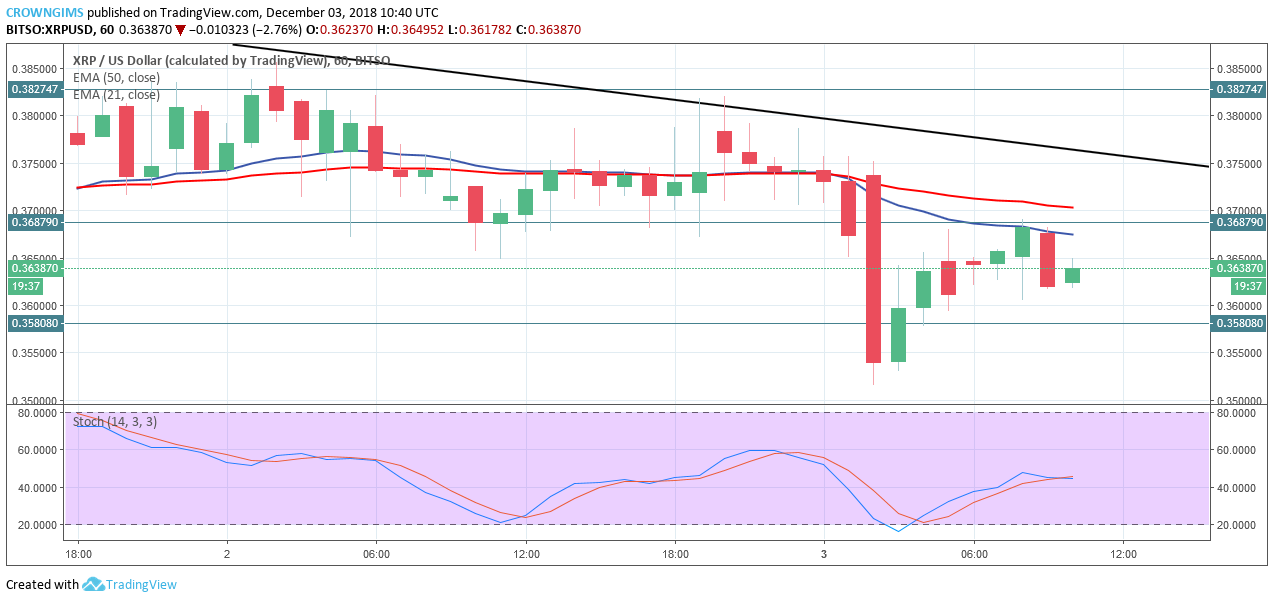
XRP/USD is bearish on the 1-Hour chart. The coin consolidated yesterday. The first and the second candle formed at the opening of the market today were bearishly followed by a strong bearish engulfing candle that pushed the price below $0.35 support level. The price correction has been carried out on the 1-Hour chart to the broken level of $0.36.
The bearish trend may continue as another bearish engulfing candle has formed below the 21-day EMA and 50-day EMA coupled with Stochastic Oscillator period 14 about bending down.


