XRP-USD

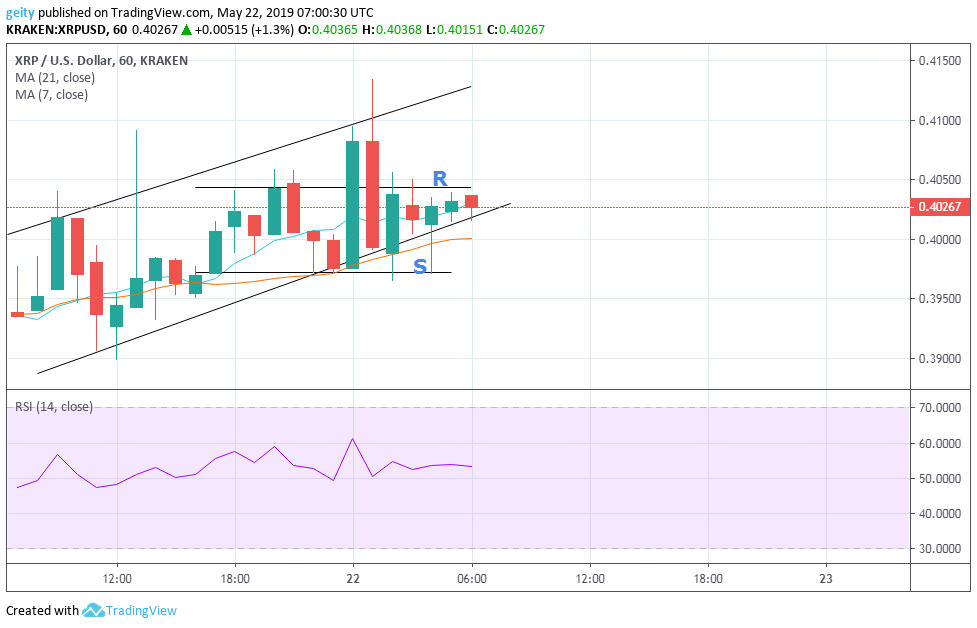
The outlook price performance of (XRP) is trending in an ascending channel; reflecting an uptrend that has been buttressed by the moving averages, which are also moving in an upward manner. The 7-day MA is seen above the 21 day MA indicating bullish momentum.
The bears seemed to have the upper hand since XRP started trading at $0.39392 and is currently trading at $0.38169, therefore, an downward price rally is observed.
The RSI is below 50 thus confirms the downtrend and is also reflecting the high level of buying pressure. The resistance level is at $0.40442 and support level is at $0.37.
The increase in the price rate of XRP has led to a positive impact on investors whereby Brad Garlinghouse says that XRP is ready to work with financial institutions such as banks and regulators.
FORECAST
Since the 7-day MA is still above the 21-day MA indicating a positive signal in the next few hours, new support should be placed at $ 0.38.
EOS-USD

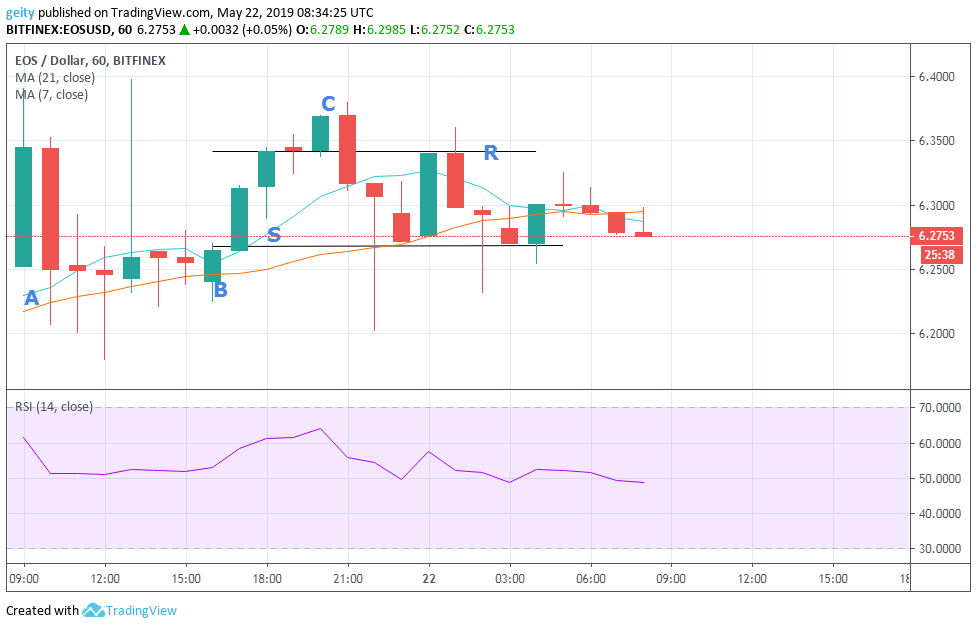
An uptrend market is seen in the last 24hrs, where price action seems to be establishing a symmetrical triangle trading pattern. The day began (A) with a bullish engulfing candle that shifted up the price performance to a high of $6.2525 but later on a bearish engulfing candle emerged and dips the price performance to a low of $6.2063.
This was later followed by a period of consolidation with repeated appearance of Doji candles reflecting luck of momentum in the market.
A bullish market rally is encountered at (B) where traders pushed the price rally up past resistance (R) $6.3417 closing the price at $6.3686, a sideways price movement later followed. With cryptocurrency tasting towards the Support level (s) $6.2687 and resistance level.
The 7-day MA is seen below the 21-day MA thus confirming the descending price rally. EOS began trading at $6.3448 and currently is trading at $6.02; this shows that is down by 4%.
FORECAST
At the last 2hrs the 21-day MA crossed over the 7 day MA indicating a bearish signal, the RSI is breaking below 50 showing scope for further downside in the next few hours. Traders should wait for the price to break out of the symmetrical triangle pattern before they place an entry.
XLM-USD

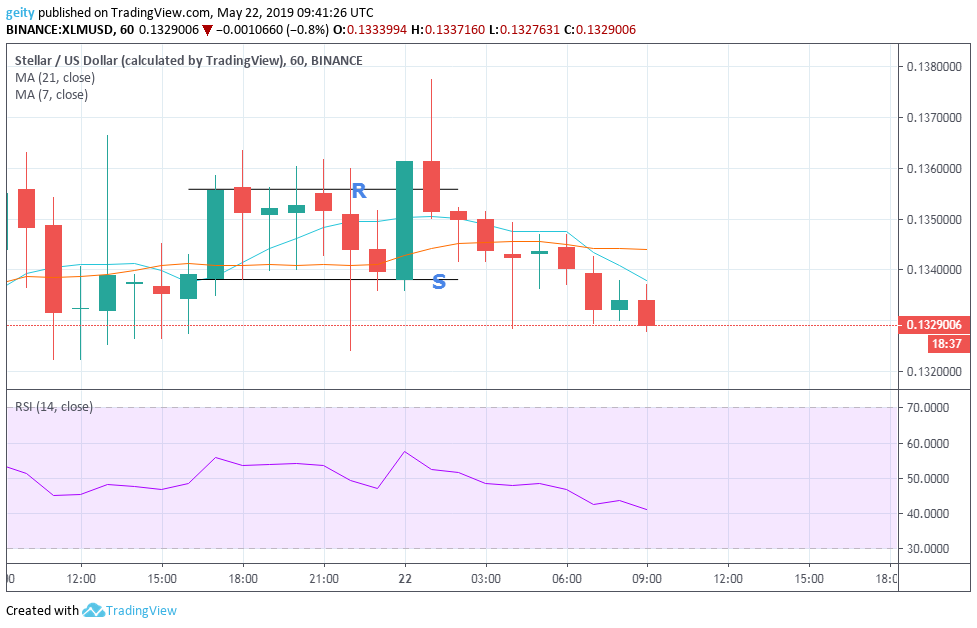
XLM incited trading at $0.134828, with a bearish hidden divergence pattern that came with increased selling pressure. The moving averages are intertwining confirming a ragging market.
Repeated emergence of Doji candlesticks reflects equality and indecision in the market momentum that results in periods of consolidation. Around 21 May ’19, 17:00 XLM signaled a bullish engulfing pattern that rose the price up to $0.1355665.
Resistance level was later placed at $0.1355665 and support level at $0.131. At around 22 May 2019 00:00, the bulls pushed the price up at $0.133 that was followed by a bearish hidden divergence pattern that further dip the price momentum to the current price $0.127.
A bearish outlook is therefore seen in the last 24 hours due to increased selling pressure that has resulted because the stellar development foundation and partnerships with the stellar network may be doing very little or nothing to support the price of XLM.
FORECAST
The RSI is steeply declining this shows that price decrease is likely to be seen, the 21 day MA is above the 7 day MA during the last 3hrs this shows continuity in a price drop. New resistance level should be placed at $0.13 and stop-loss to be set above or below the resistance level for defense purposes.


