
 Technical Analysis #006 - Tron Experiences A Short Term Rebound As Token Swap Approaches")
Tron has experienced a slight rebound from its previous downtrend as prices have risen 5.5% over the past 24 hours. This rebound comes after TRX has experienced a difficult 30 days as prices are down a total of 33%.
Tronix, the token behind Tron, is currently trading at $0.045 per coin and is currently sitting at rank 10th in terms of overall market cap across the board with a market cap of $2.98 billion.
The token has experienced much excitement due to the founder being Justin Sun, Forbes Asia 30 under 30 and Jack Ma, AliBaba Founder, self confessed mentee. Tron was designed to become a decentralised content sharing platform based on the blockchain. It was intended so creators of content can become the owners of their own content and not have to rely on a middle man such as YouTube.
The Tronix token has a major token migration soon where all tokens will be swapped from ERC-20 tokens to official TRX mainnet tokens. Token holders will be required to send all of their tokens to exchanges to take part in this token migration.
Let us take a look a price action over the recent period for Tron.
Price Analysis
TRX/USD – DAILY CHART – SHORT TERM
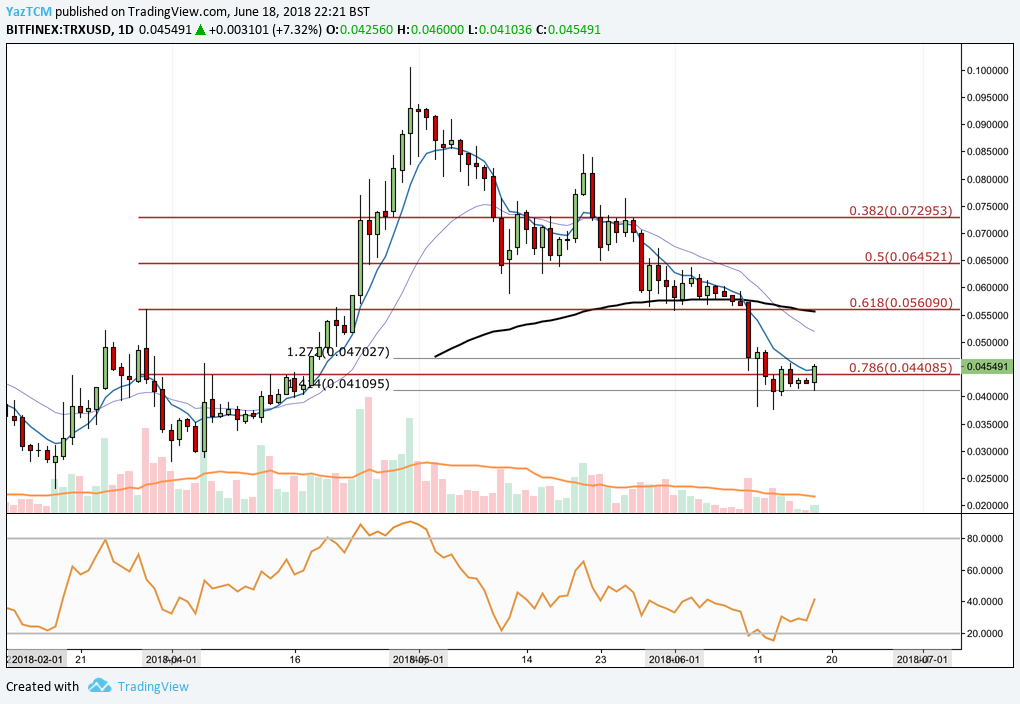
https://www.tradingview.com/x/KFH93bFP/
Looking at the chart from the short few month period above, we can see that April was an extremely bullish month for the Tronix token as price increased by an incredible 260%. Since then, price action has declined and fallen just past the .786 Fibonacci Retracement located at $0.0445.
Price action broke below the .786 Fibonacci Retracement and headed lower until it found support at a 1.414 Fibonacci Extension located at $0.04109. This is an extension of the bearish leg taken from the high seen on the 30th of April to the swing low seen on the 12th of May. We can see that during the course of the previous week, the market managed to find support at this $0.041 level and rebounded.
Price action is currently just above the .786 Fibonacci Retracement at a price of $0.0454 per token. If the market can close above $0.044 over the next few days then we could expect a bullish rally into near term resistance located at the .618 Fibonacci Retracement at a price level of $0.056. If price action can break above here, this would leave the market in the range it was trapped in between before ‘Bloody Sunday’ last week.
The RSI is showing improvement as it makes its way toward the 50 handle. If it can break and hold above 50 this would indicate that the bullish momentum within the market is growing and should continue to grow.
Tronix has also recently started trading above the 7 day EMA which should send some slight form of hope to the bulls. If the 7 day EMA can eventually cross above the 21 day EMA then we may see the bullish run continue.
Let us examine how TRX has been performing against Bitcoin over the recent term.
TRX/BTC – DAILY CHART – SHORT TERM
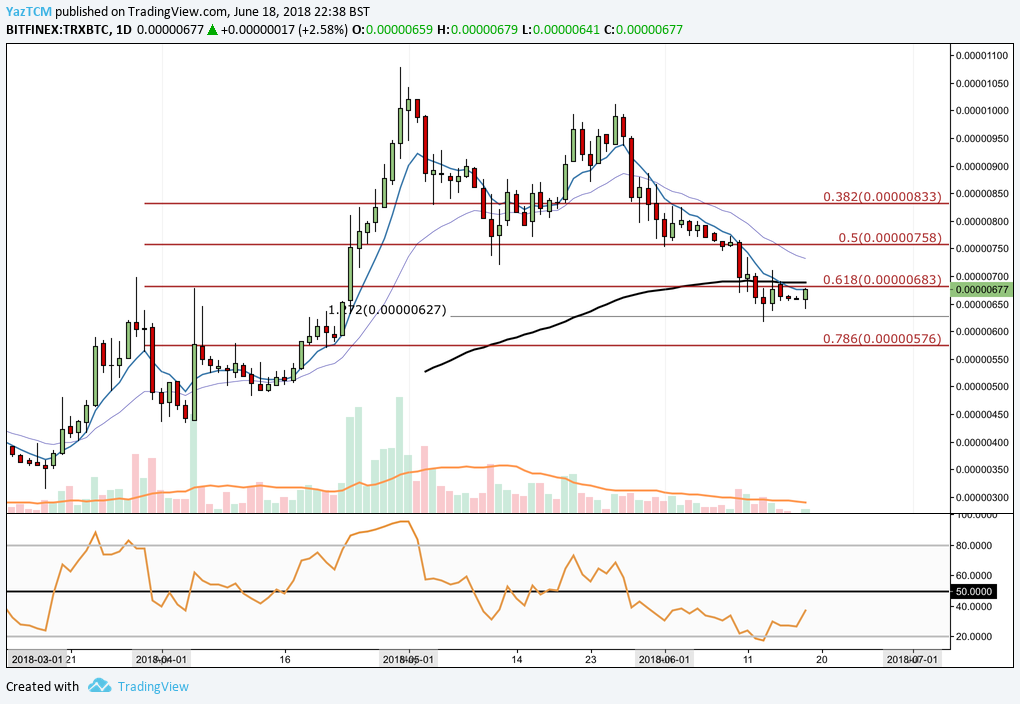
https://www.tradingview.com/x/ia3bKDbV/
Looking at the chart above, we can see that TRX had also experienced the same bullish run during April. In our previous article, here, we had outlined the 1.272 Fibonacci Extension as support at a price level of 627 SATS. We can see that price action hit this level and was strongly rejected as it rebounded.
Price action is currently trading at the 677 SATS just below the .618 Fibonacci Extension at 683 SATS. If price action can continue in this bullish momentum and close above 683 SATS then we could expect price to be retesting the .50 Fibonacci Retracement at 758 SATS within the next week. Resistance further that this is located at 833 which is the .382 Fibonacci Retracement.
Alternatively, if the short term bullish momentum fades we could see price action rolling over once again and re-testing the 1.272 Fibonacci Extension at 627 SATS. Support found further below this level is 576 SATS which is the .786 Fibonacci Retracement.
The technical indicators are showing some positive signs towards the bulls. The RSI is making its way back toward 50 after trading within oversold conditions for a few days. If the RSI could break and hold above 50 this would mean that bullish momentum is growing.
Price action also seems to be finding short term resistance at the 7 day EMA. If price action can break above this and the 7 day EMA can go on to cross the 21 day EMA over the next few weeks this would create a bullish environment for TRX during July.
CONCLUSION
With the token migration upcoming we could expect the volume within the market to dry up. Whilst volume is low it causes the market to become volatile meaning that a small amount of buyers/sellers can shift the market very easily.
It would be beneficial to remain patient as a trader and not to open any new positions until the token migration has been fully completed.

