Distribution Territories: $0.023, $0.024, $0.026
Accumulation Territories: $0.022, $0.021, $0.020
TRX/USD Medium-term Trend: Bearish

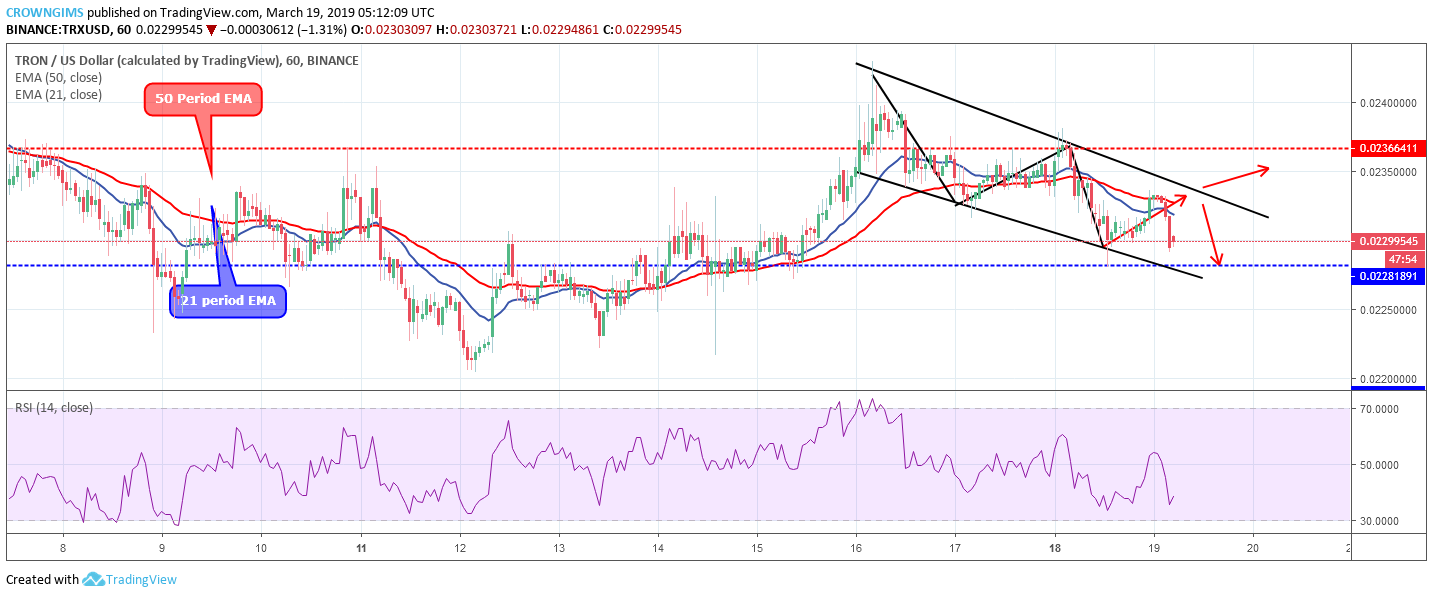
TRX/USD is on the bearish trend on the Medium-term outlook. A low of $0.022 price level was recorded on March 12. The bullish momentum made the TRX to climb the peak of $0.024 after broke up the price levels of $0.022 and $0.023. TRX then experience a sharp drop to $0.023 price level by the Bears’ pressure. Since then, the coin has been trading below the distribution territory of $0.023, establishing the descending channel pattern. The TRX price is trading within the channel towards the accumulation territory of $0.022. TRXUSD may continue to wave within the area of the channel.
From above, a heavy buy-off could send the TRX price to $0.024 and $0.026 price level provided the bullish pressure break up the upper trend line of the channel. From below, a huge sell-off might also make a bottom at $0.022 and $0.021 in case the accumulation territory of $0.022 does not hold. Meanwhile, the Relative Strength period 14 is at 50 levels with the signal lines bending towards the south indicate sell signal.
TRX/USD Short-term Trend: Bearish

TRX/USD is on the bearish trend on the short-term outlook. The coin is under the bears’ pressure after a sudden drop in price from the high of $0.024 to the low of $0.023 price level. The TRX price is trading within the descending channel towards $0.022 price level.
At the moment, the RSI is at 40 levels with the signal line pointing down, suggesting a strong downward movement which may touch the accumulation level of $0.022. The coin is trading below 21 periods EMA and 50 periods EMA which indicate bearish momentum. Further increase in pressure of the Bears may break down the level and expose $0.021 price level.


