

Distribution Territories: $0.029, $0.031, $0.034
Accumulation Territories: $0.027, $0.025, $0.023
TRX/USD Medium-term Trend: Bullish
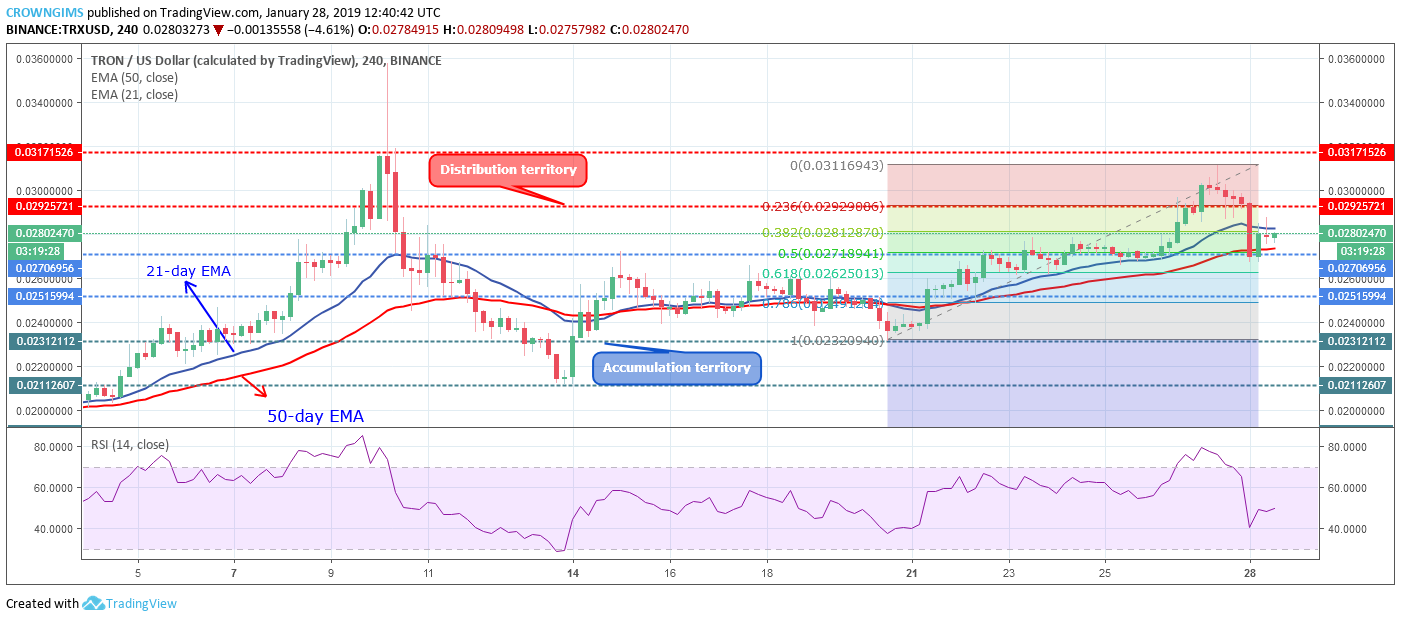
TRX/USD is on the bullish trend on the Medium-term outlook. There was a retracement on the 4Hour chart after the bullish trend that occurred on January 15. This scenario leads to price consolidation for more than four days and the coin bottomed at $0.023 price level on January 20. The bulls gathered momentum, broke up the distribution territory of $0.025 and the TRX price inclined towards $0.031 price level after broken the barrier at $0.027 and $0.029. The Bulls lost the momentum and there was a 50% Fib price retracement to the $0.026 price level.
After price retracement, the coin restored to its former trend and that is why a strong bullish candle formed. The coin is currently trading in-between the 21-day EMA and 50-day EMA with the bullish candles formation while the Relative Strength Index period 14 is at 50 levels with the signal line pointing up which connotes buy signal. In case the Bulls maintain or increase their pressure the cryptos may have its target at $0.031 price level. Alternatively, in case the accumulation territory of $0.023 does not hold, the accumulation territory of $0.023 will be its support.

TRX/USD Short-term Trend: Bearish
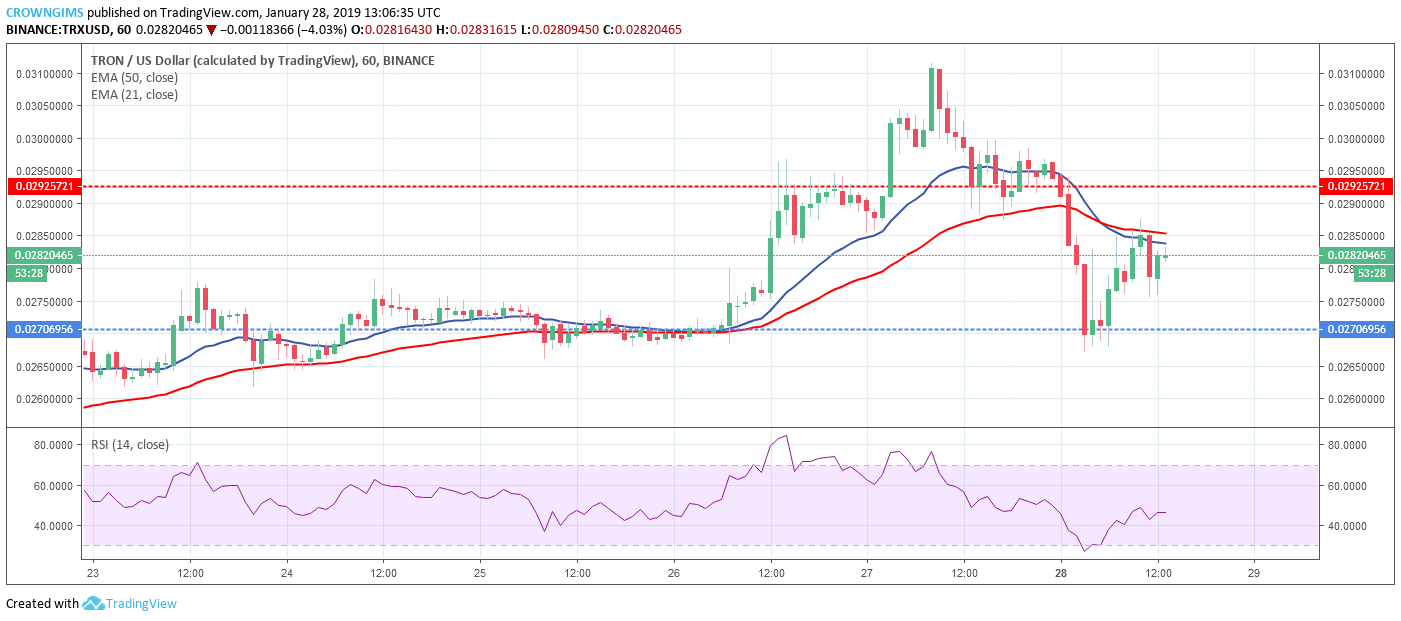
TRX/USD is on the bearish trend on the short-term outlook. The higher highs movement made by the bulls on the TRX market topped at $0.031 price level last week. The tweezer top candle pattern formed implies the influx of bears into the TRX market which returned the coin to the previous low of $0.026 accumulation territory after the broken down of $0.029 price level. The Bulls defended the level and the TRX price bounced and the coin moved towards the $0.029 level which was resisted by the dynamic resistance and support.
The 21-day EMA has crossed the 50-day EMA downside and the TRX are currently trading below the two EMAs which indicates a bearish pressure on the TRX market. The relative strength index period 14 is above 40 levels pointing down which implies sell.

