

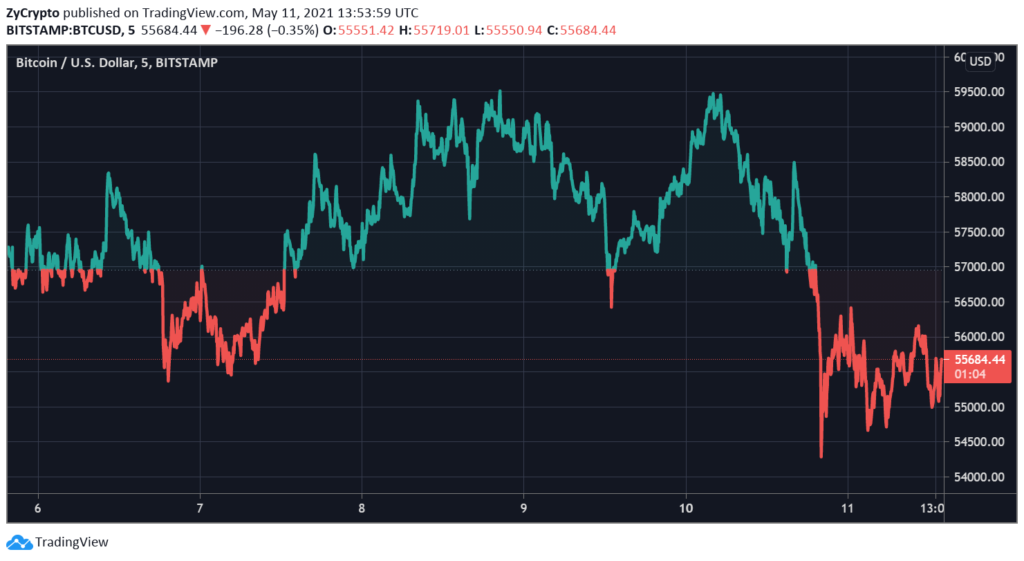
Bitcoin entered the month of May above $50,000 but has been range-bound below the $60,000 price mark since the 18th of April. Bitcoin hit a daily high of $59,464 on Sunday, this is the highest price the leading cryptocurrency has recorded since the start of the month. With the second quarter moving at a slower pace than the first, Bitcoiners are uncertain of whether or not the bear trend has stepped in.
Usually with the altcoin rally comes a traditional drop in Bitcoin’s price, as it is expected that investors are rotating cash from Bitcoin to other altcoins. However, this may not be the case at all. In fact, the opposite might be the case when analyst William Clemente’s recent assertion of the current state of the Bitcoin market is considered.
There is a bullish explanation for the state of the Bitcoin market
Clemente recently weighed in with some fundamental analysis in which he describes the state of the Bitcoin market, explaining why the Bitcoin bull run is far from over, and why the bear market points to a bullish pattern from the within than it does in a weak market.
Historically, when the Bitcoin bull run is rounding up, there’s a similar pattern the market follows. As explained by the analyst: “For starters, Bitcoin tops are marked by increasingly parabolic price action until a blowoff top occurs and demand steps back.”
But William continues to say that this is not the case at all. We are not seeing that. Instead, capital is accumulating at an increased rate.

“There is a massive base of capital (on-chain volume) building at these levels. Cycle tops have very minimal distribution.” Clemente explained.
Another way to identify a Bitcoin market top, according to on-chain metrics, is to pay attention to the spike in dormancy. This is usually the case with Bitcoin, as old coins are sold by weak hands to stronger hands.
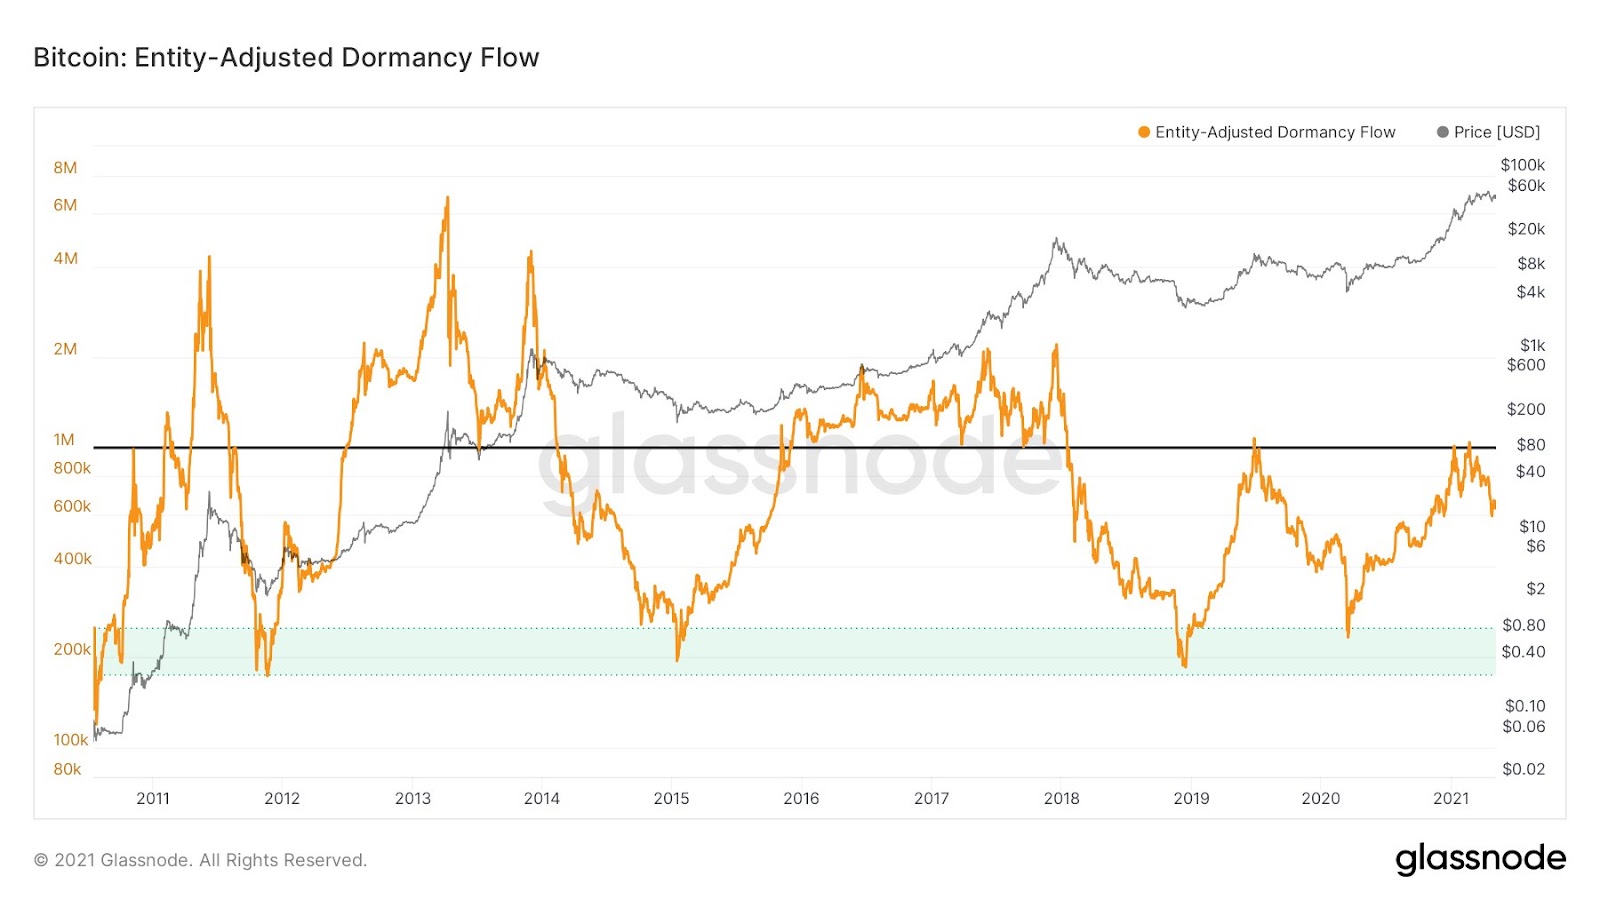
As shown in the chart above, dormancy has been declining continuously since February. This is a sign, according to the analyst, that older hands are keeping their eyes peeled out for when prices hit rooftop before they “unload their bags.”
So if the bears are not here yet, who is selling?
In terms of illiquid supply, he notes that there has been an unending pattern of coins moving into addresses that are “statistically unlikely to sell.” Another metrics to watch is the MVRV Z-Score, which is still not signaling a peak in the Bitcoin bull run. The Reverse Risk metric which gauges the confidence of holders is taking a downturn, showing that the trust is still unshaken, despite the Bitcoin price dips.
It is important to note that three supply peaks which are held by Bitcoin shorters, precedes every bull market cycle. “We are still cooking off after just the first peak of the cycle,” says the analyst.
Since every metric above reflects a healthy market for Bitcoin, why are prices still dropping and who is responsible for selling? Weaker hands, or as Clemente calls them “inexperienced market participants” are the culprits. This has been reflected in the age of coins leaving the market, which has been going downward since February. Like most other analysts’, he closes with an objective piece of advice for Bitcoiners: Hodl.


