

PlanB, the creator of the Bitcoin stock-to-flow (S2F) model, has been using it to forecast the price movement of Bitcoin. PlanB has reaffirmed that the model is still in play.
The novel sign pointed to data from June that forecasted based on the model, that the floor price or worst-case scenario of Bitcoin for September would be $43,000, stating that it was not an error. PlanB also adds that despite the likelihood of Bitcoin returning to $43,000 in September, October will see it regaining a $63,000-floor price making the September price a “data blip” that should not be worried about.
The S2F model which uses scarcity to quantify Bitcoin’s value has so far mirrored the market. The June tweet, which caused quite a stir at the time, has in retrospect been accurate in forecasting that following fear, uncertainty, and doubt in the market caused by China’s Bitcoin mining crackdown and Elon Musk’s change of stance as Bitcoin saw weak action in June and July. The model further went on to call the floor price for August to be $47,000, $43,000 for September, $63,000 for October, with $98,000 and $135,000 for November and December respectively, based on price and on-chain data.
However, the reaffirmation of the model’s accuracy by PlanB, if it plays out, could contradict the expectations of some analysts who think Bitcoin’s price could hit a $100,000 value in the short term – in or before October. The implications of an S2F model $63,000-floor price forecast could mean that on the one hand, Bitcoin could reach a $100,000 value as others are speculating, but fail to sustain those levels and drop back to levels closer to $63,000, or on the other hand, completely fail to reach a $100,000 value until way after October.
Concurrently, on-chain data is also echoing a strongly burgeoning Bitcoin market. According to an August 16 report from blockchain data and intelligence provider, Glassnode, a growing number of on-chain metrics point to a bullish rally being in effect in the market.

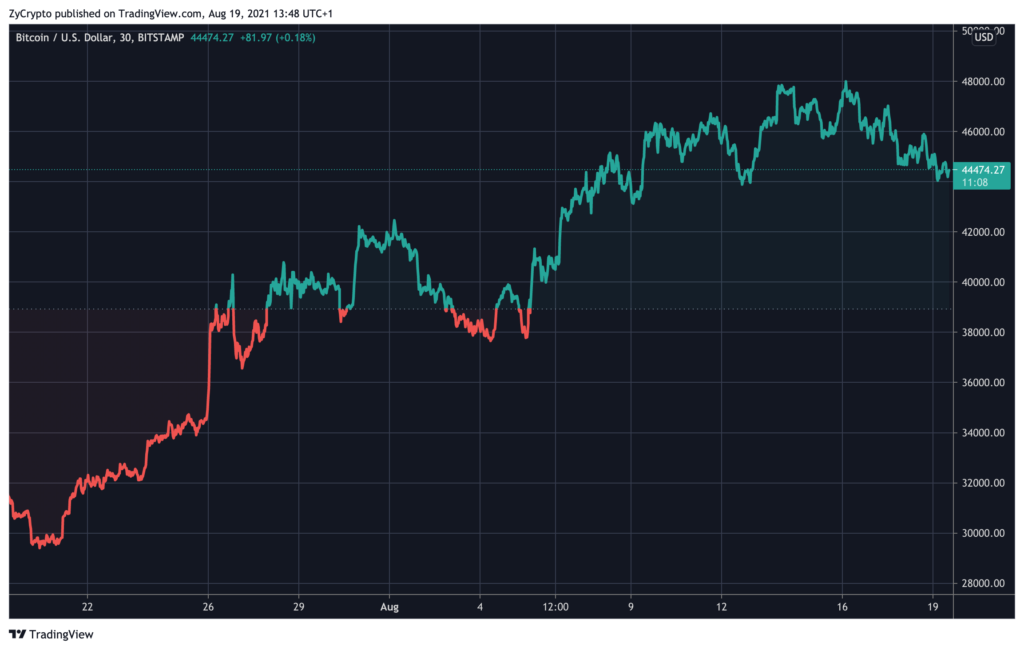
The report indicates that the market has shown strong fundamental spot demand as the surge in Bitcoin’s price has sustained in the new week, setting daily highs of around $47,000, a great improvement from the July low of about $29,700.
Another metric supporting the bullish narrative is also the increased revenue accruing to miners. The network has seen an increase in hashrate, which fell 50% in May but were 25% up from those lows, suggesting that about 12.5% of the offline Chinese miners had come back online.
Additionally, the report points to the realized cap. Realized market cap is the on-chain equivalent of the Bitcoin market cap. It is measured by its uptrends (when coins acquired cheap are spent, creating upward sell-side pressure), and downtrend (when coins accumulated at higher prices are sold at a loss, indicating a bear market). The metric, which has reached a new all-time high of $379 billion, indicates that the market is absorbing sell-side pressure as new capital was continuously driving spot prices continuously upwards.
A second aspect of the realized cap metric, the net realized profit and loss also indicates that since the July low of about $29,000, the trend of net realized losses which set in between May and July, had reversed to net realized profits of between $0.5 billion to $1.5 billion daily. The report summarises that if the market can continue to absorb capital inflows, it is highly conceivable that the market will proceed to strengthen.


