
 Technical Analysis Trades Sideways as the Market Approaches the Apex of a Triangle")
Stellar has seen a small 2.05% price increase over the past 24 hours of trading. The cryptocurrency is currently exchanging hands at a price of $0.2478 after experiencing a price decline of -3.47% over the past 7 trading days.
Investors received good news over the past few days on the announcement that the company Smartlands has secured a partnership with the real estate agent Colliers International. The real estate agency plans to tokenize properties on top of the Stellar platform with the help of Smartlands. Colliers International had reported revenues of up to $2.7 billion during 2017 and has continued to grow ever since.
Stellar is currently ranked in 6th position in terms of overall market cap across the entire industry. It has a total market cap value of $4.66 billion after the 50 month old coin sees a 25% price increase over the past 30 trading days. Stellar is now currently trading at a price that is 70% lower than its all time high value.
Let us continue to analyse price action for Stellar over the short term and highlight any potential support and resistance areas.
Price Analysis
XLM/USD – SHORT TERM – DAILY CHART
https://www.tradingview.com/x/6VgvTtvu/
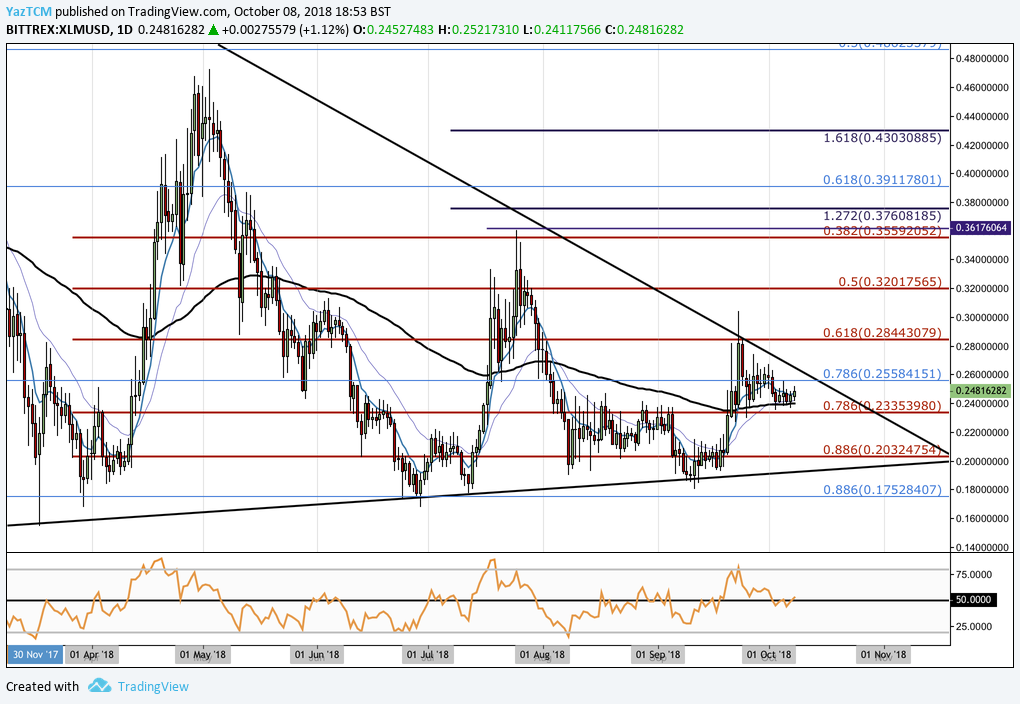
Analysing the market from the short term perspective above, we can see that Stellar has seen a price increase when price action started from a low of $0.1679 on March 30th 2018 and extended to an high of $0.4723 on May 3rd 2018. This was a total price increase of 170% from low to high.
We can see that price action has also been trading within the confines of a large triangle consolidation pattern. The triangle is clearly characterised by the upper boundary as the falling resistance trend line and the lower boundary as the rising support line. Price action is approaching the apex of the triangle and a breakout is expected is expected to the upside if there is enough volume within the market.
Moving forward, price action is currently trading at resistance provided by the long term .786 Fibonacci Retracement level (drawn in blue) priced at $0.2558. If the bulls can push the market above this resistance and above the confines of the triangle then we can expect further resistance higher to be located at the short term .618 Fibonacci Retracement level (drawn in red) priced at $0.2844.
If the bullish momentum can push the market even higher, we can expect further resistance to be located at the .5 and .382 Fibonacci Retracement levels (drawn in red) priced at $0.32 and $0.35, respectively.
Alternatively, if the bears push the market lower we can expect immediate support below to be located at the short term .786 Fibonacci Retracement level (drawn in red) priced at $0.2335. Further support below this level can then be found at the .886 Fibonacci Retracement level (drawn in red) priced at $0.20 followed by the lower boundary of the triangle pattern.
If the bears push the market below the confines of the triangle we can expect more support at the long term .886 Fibonacci Retracement level (drawn in blue) priced at $0.1752.
The technical indicators within the market are currently producing neutral readings. The RSI indicator is currently trading at the 50 handle which indicates that neither the bulls nor the bears are in control of the momentum within the market. If we are to expect a bullish push higher, we would need to see the RSI break above the 50 handle.


