
 Technical Analysis #001 - Stellar Rebounds at March’s Low Price")
Stellar has experienced a decent start to the month of July as the value of XLM increases by 11.29% over the past 7 trading days. The cryptocurrency is currently being traded hands at a value of $0.2105, at the time of writing. This price increase comes after two months of declining prices where Stellar has fallen by 27% over the past 30 days alone.
Stellar was created in 2014 when Jeb McCaleb forked Ripple to create the project. It is a financial platform that connects individuals, institutions and payment systems. Effectively, it enables low cost interbank transactions across borders and helps those that aren’t part of the financial system to have access.
The platform can boast faster speeds than many other cryptocurrencies with cross country payment transactions occurring in less than 5 seconds. The Stellar Development Foundation has a vision to expand financial assets to everybody worldwide and has the technology now crabapple to do this as the Stellar Network can handle tens of thousands transactions per second.
The crypto giant is currently sitting at rank 8 in terms of overall market cap across the board with a market cap value of $3.95 billion.
Let us continue analyse price action over the course of the year.
Price Analysis
XLM/USD – LONG TERM – DAILY CHART
https://www.tradingview.com/x/EACZNodk/
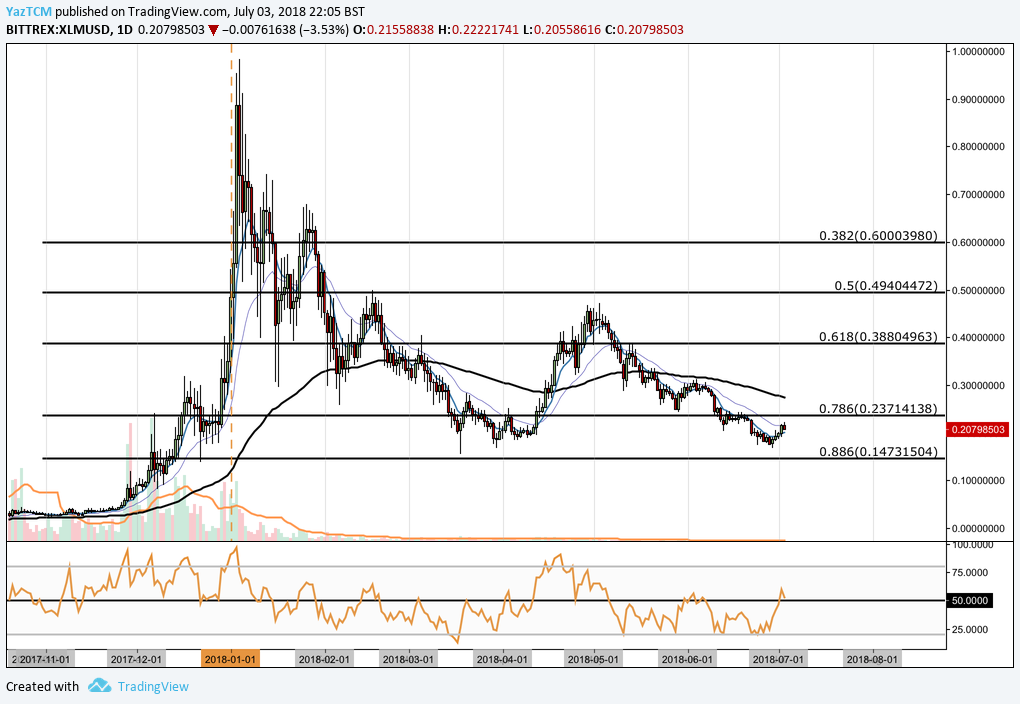
The chart above shows the Lumens market, XLM, over the course of the year. We can see that XLM had experienced a bullish run starting from a low of $0.021 in November 2017 continuing upward until reaching an all time high at $0.98239 in January. This was an epic 7250% increase in value from low to high.
Since placing this high, price action went on to decrease, before reaching a low in March close to the .886 Fibonacci Retracement priced at $0.14731. This is a Fibonacci Retracement taken from the entire bullish run described above.
Price action went on to rise in April before reaching resistance close to the $0.50 level. It then proceeded to depreciate for two months during May and June to where it is currently trading today between the .786 and the .886 Fibonacci Retracement trading at a price around $0.021.
Let us analyse price action a little closer over the more recent term,
XLM/USD – SHORT TERM – DAILY CHART
https://www.tradingview.com/x/tRTE9UJB/
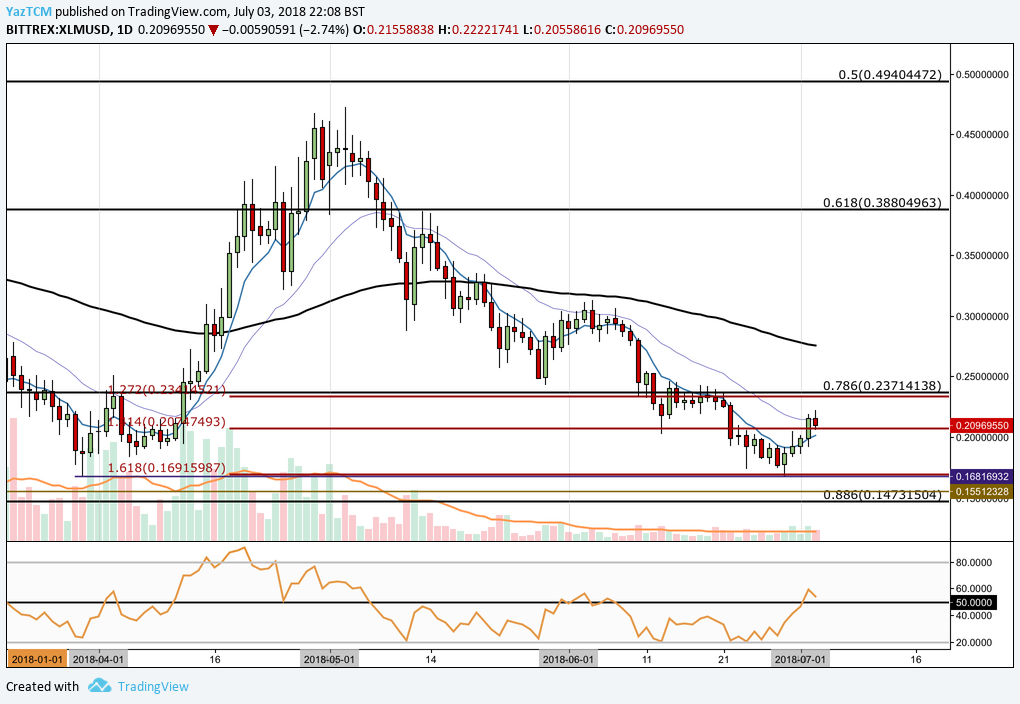
Analysing the market from a closer perspective, we can see that during April, Stellar had experienced another bullish run rising from a low of $0.679 on the 30th of March to a high of $0.4723 on the 3rd of May. This was a price crease of 200% from low to high.
Since placing this high in May, price action began to roll over and start its two month decline. We can see that price action had found support in June at the 1.414 Fibonacci Extension priced at $0.20747, this is a Fibonacci Extension taken from the initial bearish swing seen during the first week of May.
Price action went on to collapse through the 1.414 Fibonacci Extension until it found support at the 1.6168 Fibonacci Extension at a price of a $0.169159. The support in this area is also reinforced by the lows seen during March.
Price action has rebounded and has, once again, found support at the 1.414 Fibonacci Extension. If the bullish momentum can continue and the market can break above the .786 Fibonacci Retracement at $0.23714, then the market will be free to retest June’s highs at $0.4723. Resistance higher than this level can be found at the .618 Fibonacci Retracement priced at $0.38804.
Alternatively, if the market fails to hold above the 1.414 Fibonacci Extension, near term support comes in at the 1.618 Fibonacci Extension priced at $0.16915. Support following this area is located at $0.155 and then $0.147 which is the .886 Fibonacci Retracement.
The RSI has recently popped up above the 50 handle. If the RSI can manage to stay above 50, we could expect the bullish momentum within the market to continue.


