
, IOTA (MIOTA) and EOS Price Analysis and Prediction - Jan 25")
Stellar (XLM/USD)
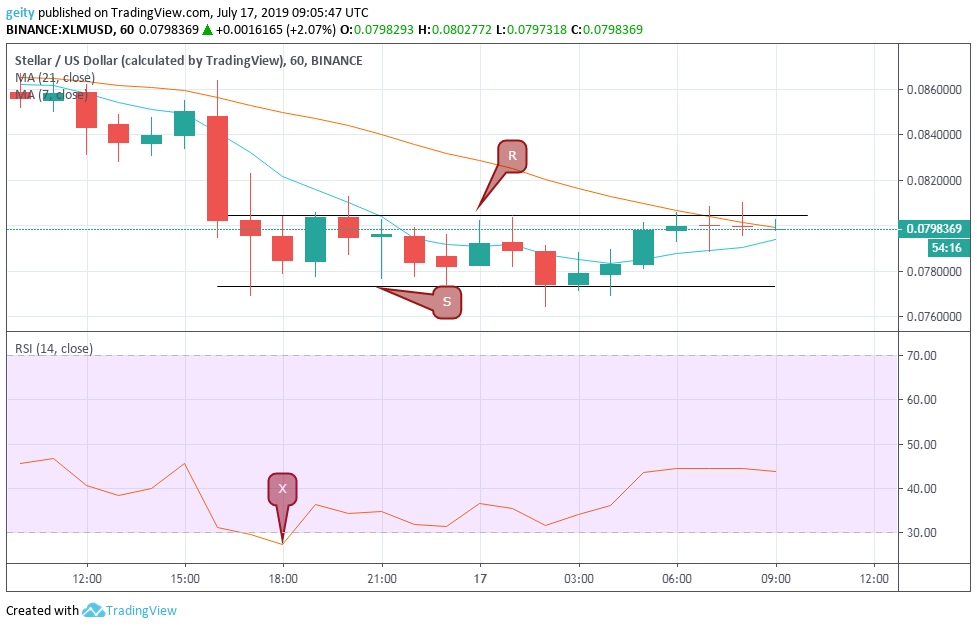
XLM/USD seemed to have undergone a Bear Run over the past 24hrs. On an hourly chart, the bullish pressure was suppressed by the 21 day MA that continuously gravitated above the 7 day MA that indicated an intense bearish outlook.
XLM/USD pair began the sell-off yesterday at $0.085164 that was followed by a price fall that resulted in a breakdown that landed to a low of $0.076879. This was reflected by the RSI indicator X that was seen below level 30 that indicated an oversold market momentum.
In addition, the downward pressure dropped the support level from $0.08375 to $0.077322 (S) and placed the resistance level at $0.080447 (R). The pair’s price later showed recovery as reflected by the RSI indicator that improved from a low of 25.15 to a high of 44.75. That showed increase buyouts.
During the last 3hr presence of a Doji was observed the reflected indecision in the market. The RSI indicator is currently trending flat that indicates a lack of momentum in the market. The dip in XLM price has widely affected investor’s sentiments.
Forecast

Currently, the 7 day MA is gravitating towards the 21 day MA and looks set to cross above it. The 7 day MA is also acting as price support. All these indicators indicate a bullish sign. New targets should be set at $0.083000.
Cardano (ADA/USD)
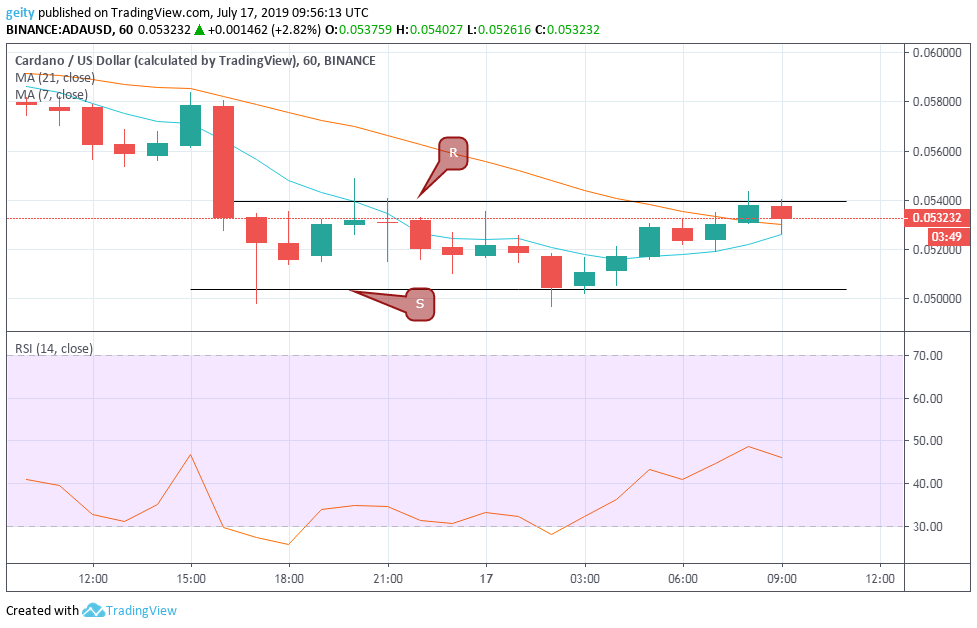
ADA/USD pair has also undergone a bearish outlook over the last 24hrs. With the 21 day MA above the 7 day MA that indicated a bearish sign. ADA has an intraday loss of 8.3% having shifted down from $0.0578 to $0.0533. The support level was dropped from $0.0555 to $0.0504 that showed an increase in selling pressure.
The Relative Strength Index indicator was seen below level 30 at several instances that showed that the pair’s price was on an oversold market condition at that period of time. Both, the resistance level $0.0539, and support level $0.0504 was tested severally.
At around 02:00 the market seemed to have gained momentum since the RSI indicator moved up from a low of 28.04 to a high of 49.15. The RSI indicator is at the moment pointing towards south showing that sellers dominate the market momentum, thus increase sellouts.
Forecast
The resistance level is likely to be breached as the 7-day MA is tending toward the 21-day MA. The 7 day MA also looks set to cross the 21-day MA. This indicates a possible bullish outlook in the next few hours. New targets should be set at $0.055.
Ripple (XRP/USD)
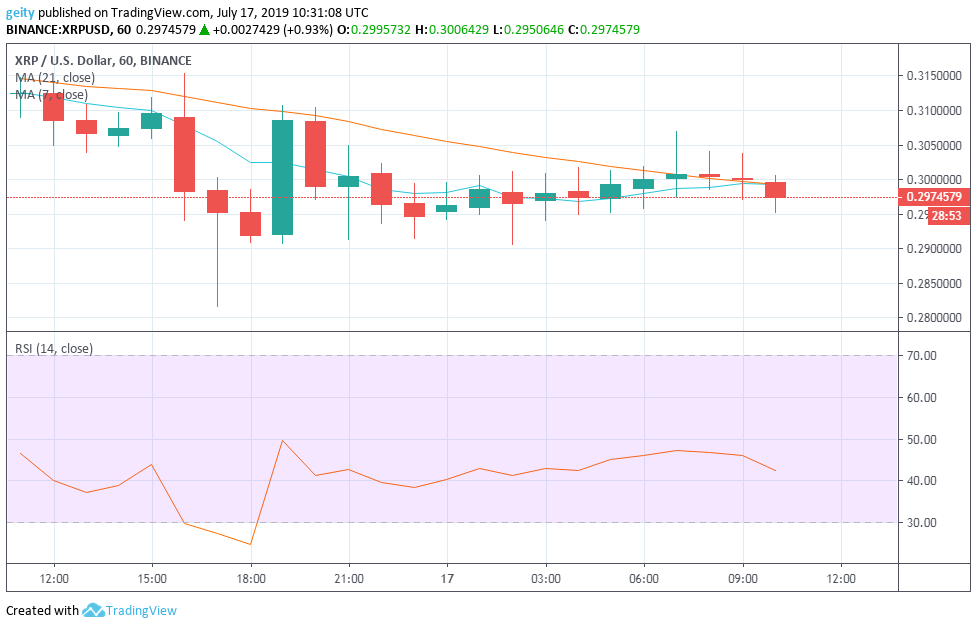
XRP/USD pair is down by 4.8% over the last 24hrs, having moved from $0.3124 to $0.2975. The downward price movement was supported by the 21 day MA that was seen gravitating above the 7-day MA. XRP/USD pair saw a medium-term drop that dipped the pair’s price down to a low of $0.2815 before embarking to a steady flow.
At around 18:00, the RSI indicator was seen below level 30 that indicated an oversold market momentum. XRP later recovered up to a high of 50 before hovering more afterward between level 30 and 50 that signaled lack of momentum in the market. The dips in pair’s price shows reduce confidence in the coin. The RSI is currently heading south, indicating increase sellouts.
Forecast
At the moment, the 7 day MA has crossed over the 21 day MA that indicates a bullish signal. An upward rally is to be expected in the coming hours. New targets should be set at $0.33.


