
 Price Prediction and Analysis")
Summary
Over the last 24 hours, there have been slight price movements for the various cryptos. Today’s focus coins performed as follows:
- Stellar (XLM) is up by 9.52%, having moved from $0.091697 to $0.10247.
- Cardano (ADA) has moved up slightly 2.17%. It started at $0.4614 and is now at $0.047616.
- Ripple (XRP) was up by 0.74% on the 3 Hour charts, having begun at $0.32010 and is now at $0.31132.
Stellar (XLM/USD)

The XLM/USD pair has put up the strongest Bull Run, gaining by close to 10% over the last 24 hours. This uptrend has positively impacted on investors seeing that the coin is undersold. The RSI (A) is at a high of 82, having hit 85 this morning. This signals high confidence among XLM’s investors who see a huge potential in the coin.
Forecast

Support has been pushed upwards and resistance tested and breached on several occasions. For the better parts of the day, the 9 day EMA (C) was above the 30 day EMA (B) with the two tending in a reverse contracting triangular pattern. This signals a bullish outlook in the coming days.
Cardano (ADA/USD)
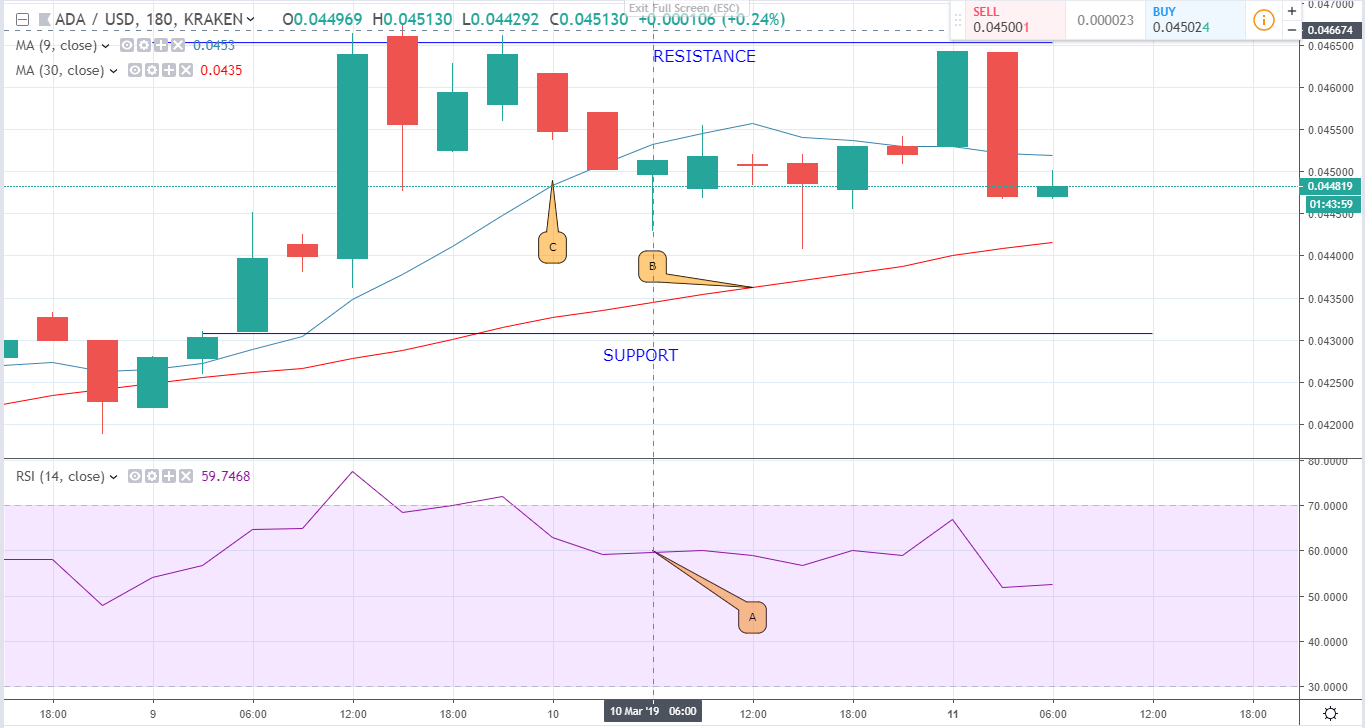
The ADA/USD pair has been consolidating at the $0.45 psychological price zone in the last 24 hours. It peaked at $0.466 yesterday which caused the RSI (A) to shoot upwards into the undersold area. Despite undergoing a slight dip, market sentiments are still up.
Forecast
Both Moving averages (C and B) are upward facing. Also, Support has moved up from $0.43 to $0.44 while resistance has held at $0.46. This price movement shows strong consolidation at $0.45 which is likely to hold in the coming days.
Ripple (XRP/USD)
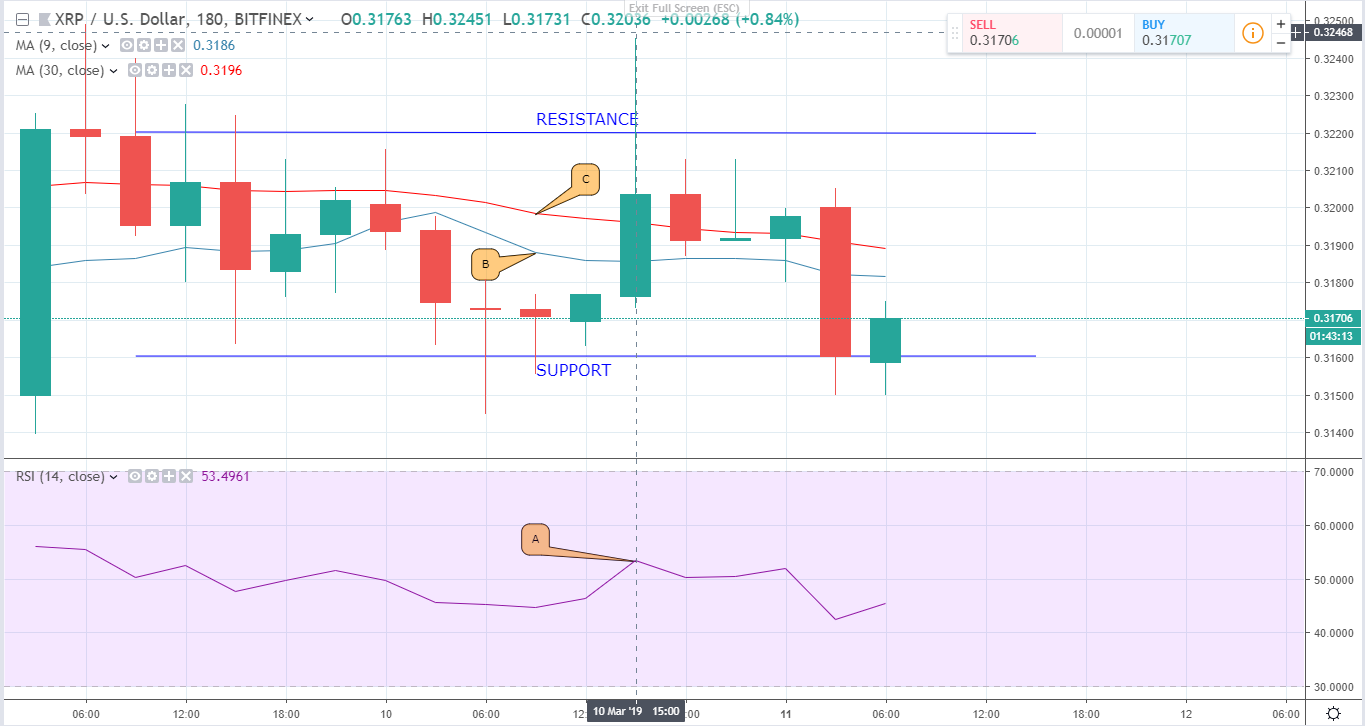
Unlike Cardano and Stellar, XRP is tending towards a bearish outlook. It’s currently down by a slight 0.93%, having moved from $0.32010 yesterday to the current $0.31132. In the markets, sales increased due to the coin’s slow price movement. This is as shown in A (the RSI).
Forecast
The bearish trend is supported by the 30 day EMA (C) which Is above the 9 day EMA (B). However, the 9 day EMA (B) is currently acting as price support. If the bulls up their momentum, an upward price rally is likely.


