
 Price Analysis: XRP is Heading towards Upper Supply Zone")
Supply zones: $0.506, $0.535, $0.564,
Demand zones: $0.468, $0.435, $0.400
XRP/USD Medium-term Trend: Bullish
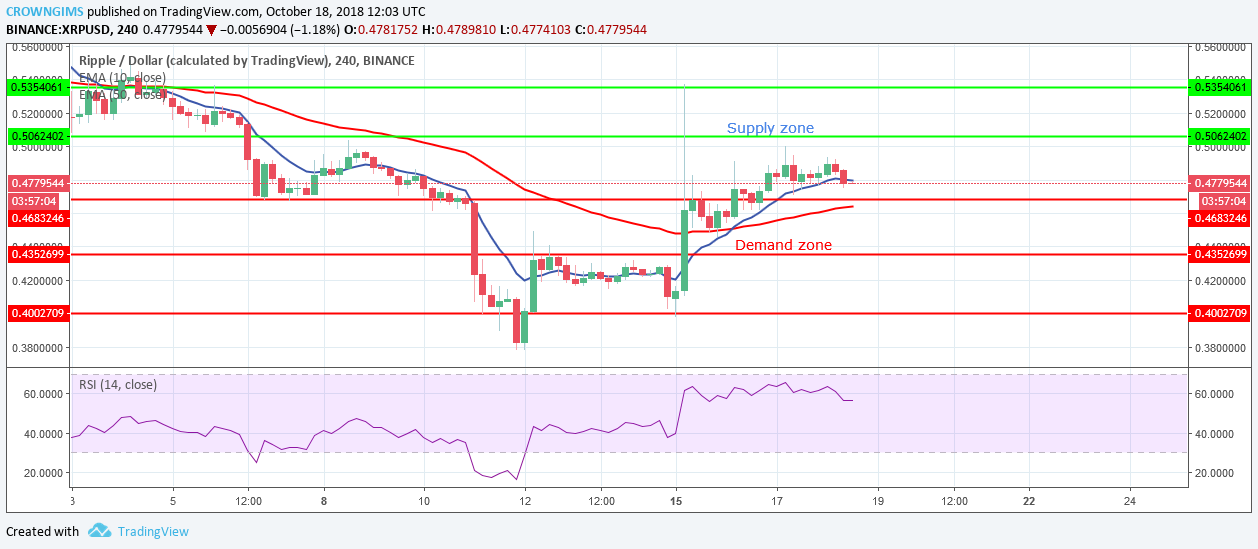
XRP/USD is bullish in its medium-term outlook. Since October 15 when almost all cryptocurrency including XRP experienced sudden price hike; XRP has been on uptrend movement.
The coin broke out from the consolidation mode on October 15 and it went up by broken major supply zones like $0.435, $0.468, $0.506 and touch $0.535. The coin bounces back at this strong supply zone with the bear’s pressure to the demand zone of $0.468. The bears lost pressure at this zone and the bulls gradually took over the control of the market.
The pair has been gradually moving up towards the supply zone of $0.506. Should the bulls maintain or increase their momentum, the supply zone will be broken upside and the coin will be exposed to the supply zone of $0.535.
As at the moment, XRP is moving below 10-day EMA and 50-day EMA with the both EMAs well separated bending towards the south, which indicates a bullish trend may change to bearish as more bearish candles are forming. The RSI period 14 is below 60 levels with its signal line pointing downward, which indicates a sell signal.
XRP/USD Short-term Trend: Bullish
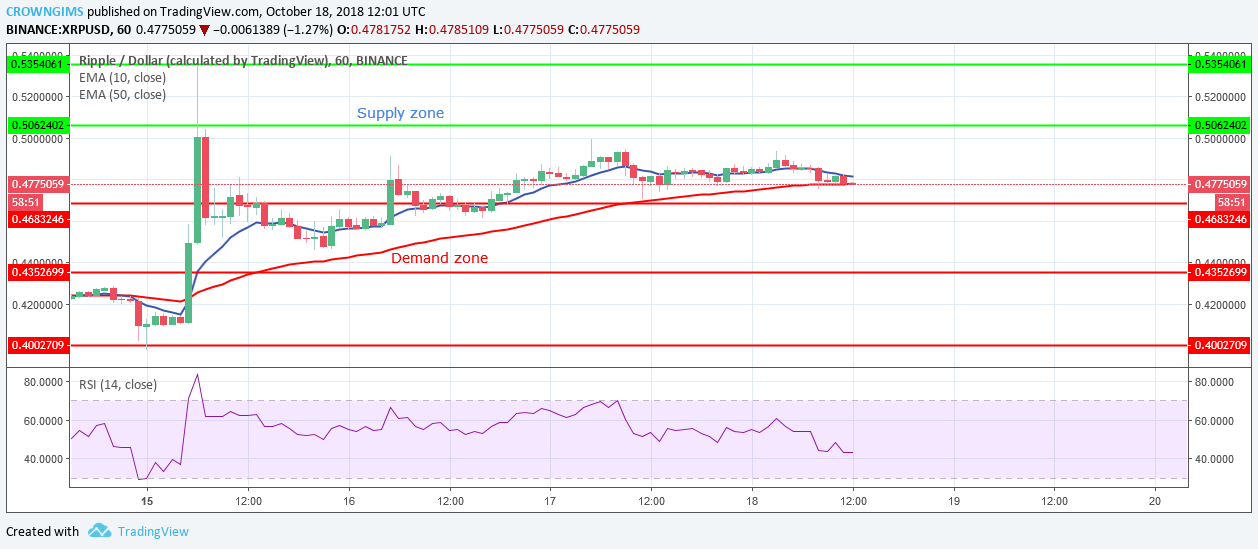
On the 1-Hour chart, XRP/USD is bullish. Since October 15 the price has been steadily moving to the north, the bulls were in control of the market till now. The bears have lost the pressure.
The coin has been above the 10-day EMA and 50-day EMA all along which indicates an ongoing uptrend. But currently, the two EMAs are getting closer with the coin in-between the two EMAs, meaning that there may be changing of the trend soon.
Nevertheless, RSI period 14 is above 40 levels with its signal line points to the south, which indicates the probability of price reversal which may be temporary before its bullish trend continues.
, and Stellar (XLM) Price Analysis – Recovery Expected Above Major Support Levels")
 and Stellar (XLM) Weekly Price Performance Overview")
