
 Price Analysis_ Bulls Struggle to Wedge Out the Bears")
Supply zones: $0.47, $0.49, $0.51
Demand zones: $0.43, $0.40, $0.39
XRP/USD Medium-term Trend: Ranging
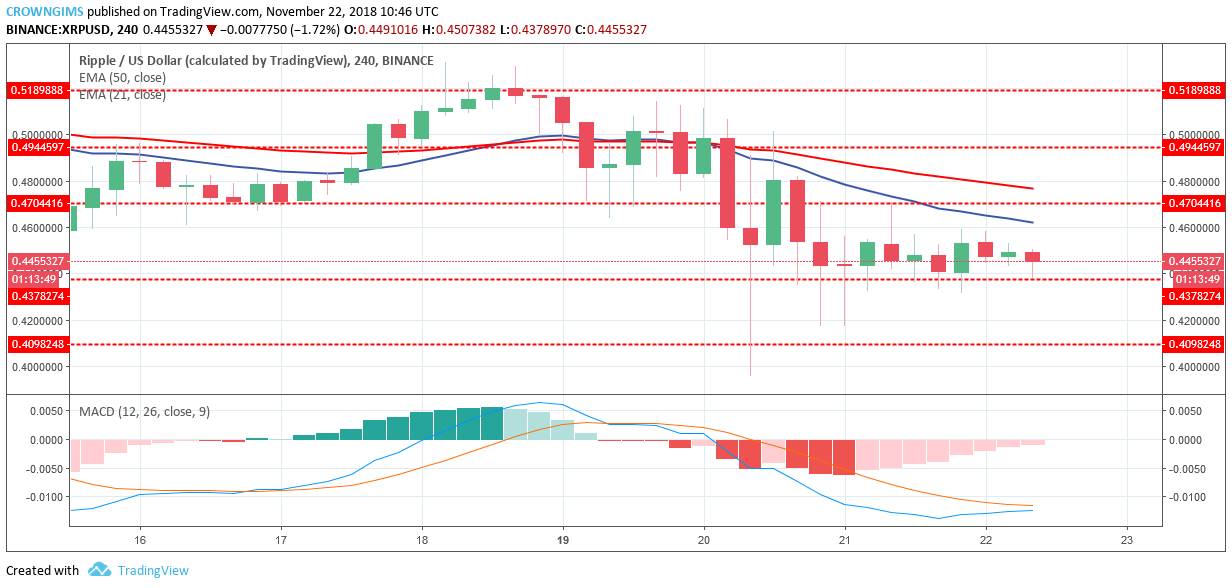
XRP is consolidating in its medium-term outlook. The bears’ pressure is pronounced on the XRP market on the 4-Hour chart as the price dropped sharply to the previous low of $0.39 demand zone. A further decrease was rejected by the bulls as the bottom long wick bearish candle formed. The upward movement was also resisted by the dynamic support and resistance and the price was pushed back to resulted into sideways movement. The coin is ranging within the supply zone of $0.47 and the demand zone of $0.43. It can be said that the price is at equilibrium.
Though the price is trading below 21-day EMA and 50-day EMA but the two EMAs are line parallel which connotes sideways movement. The MACD indicator with its histogram below zero level and its signal lines parallel below zero level indicates that ranging is ongoing. The XRP price will find its low at $0.39 in case the bears gain momentum.

XRP/USD Short-term Trend: Bearish
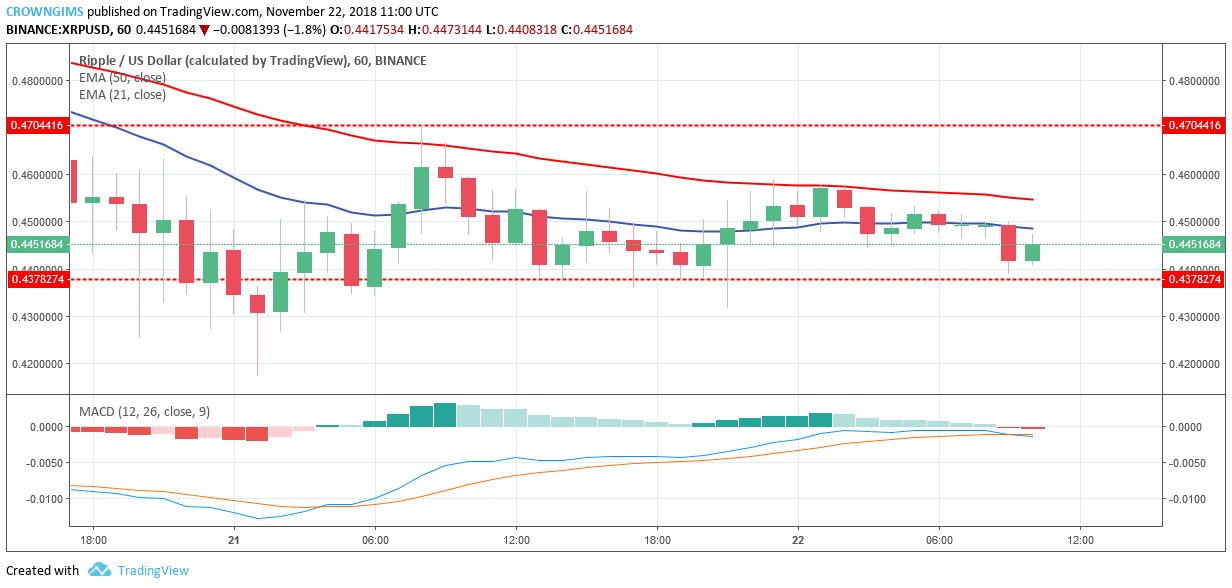
On the 1-Hour chart, XRP/USD is also in sideways movement. XRP made an attempt to break the supply zone of $0.47 upside yesterday but later lost the pressure by the resistance of 50-day EMA and the opposition from the bears. The coin was pushed down to the demand zone of $0.43, it was unable to break out, and then sideways movement continues.
The 21-day EMA and 50-day-EMA are parallel with the coin in between them which indicate that consolidation is ongoing. The MACD with its histogram is flat on the zero level with its signal lines parallel on zero level signifying the continuation of sideways movement.
 Price Up 62% From Bottom, Can The Bulls See More Gains?")

