

Ripple has seen a small 2.3% price decline over the past 24 hours of trading. The cryptocurrency is currently exchanging hands at a price of $0.5504 after seeing a well sought after 16% price increase over the past 7 trading days.
In our last article Ripple had started its majestic move. However, the announcement had not yet been made about what was causing the price to move. That announcement was the launch of xRapid.
XRapid is a product and service, designed by Ripple, that will make cross border payments more efficient in speed and cost. Currently many cryptocurrency transactions are costly and can take a certain amount of time. With xRapid these transactions are said to be almost instantaneous and have little to zero fees. XRapid has launched so far with 3 mainstream companies using the product; MercuryFX, Cuallix and Catalyst Corporate Federal Union.
Ripple still currently holds the number 3 ranked position in terms of overall market cap across the entire industry. It has a total market cap value of $21.98 and is closing in on the second position only $1 billion behind Ethereum. The 62 month old currency, XRP, has seen a 61% price increase over the past 30 trading days and is currently trading at a value that is 84% lower than its all time high value.
Let us continue to analyse price action for XRP over the short term and highlight any potential support and resistance areas.
Price Analysis
XRP/USD – SHORT TERM – DAILY CHART
https://www.tradingview.com/x/Idew2VHc/
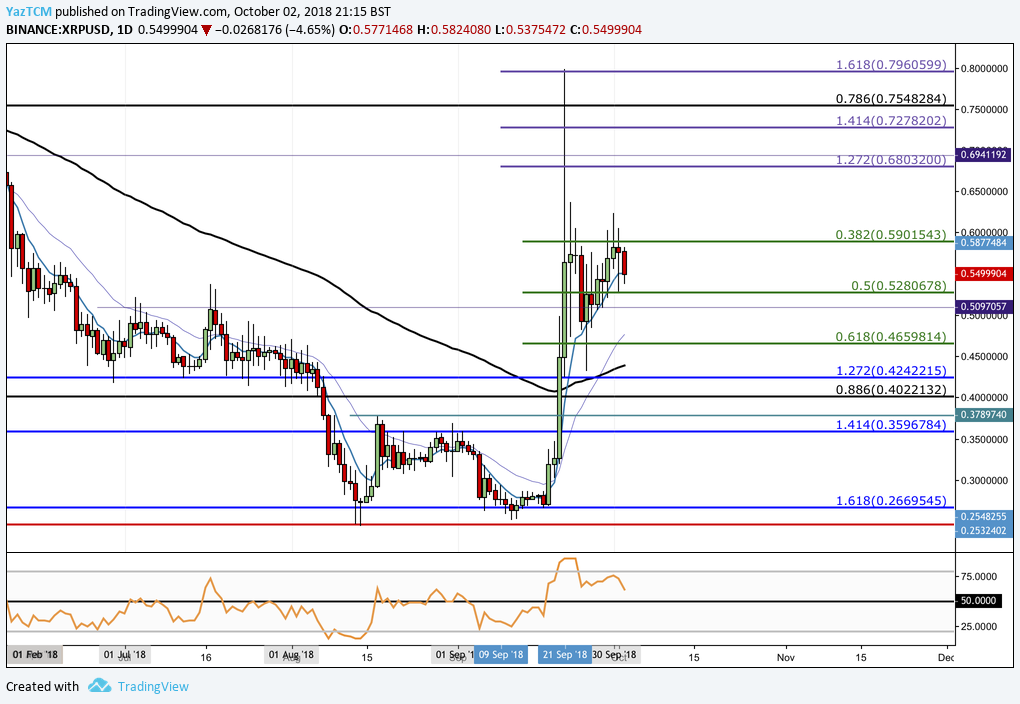
Analysing the market from the short term perspective above, we can see that price action rebounded aggressively from our support identified at the downside 1.618 Fibonacci Extension level priced at $0.266 during mid-September.
We can see that the market continued to rally until meeting resistance at an upside 1.618 Fibonacci Extension level (drawn in purple) priced at $0.7960. After meeting this resistance the market rolled over and started to fall.
Price action is now trading near support provided by the short term .5 Fibonacci Retracement level (drawn in green) priced at $0.5280. IF the bearish pressure continues within the market and pushes price action below this support level, we can expect immediate further support below at the .618 Fibonacci Retracement level (drawn in green) priced at $0.4659.
If the market continues to decline further then we can expect more support at the downside 1.272 FIbonacci Extension level (drawn in blue) priced at $0.4242 followed by the long term .886 Fibonacci Retracement level priced at $0.4022.
Alternatively, if the bulls can regather momentum and push price action higher, we expect immediate resistance at the short term .382 Fibonacci Retracement level priced at $0.5901. If the bulls can push price action further higher then more resistance can be expected at the 1.272 and 1.414 Fibonacci Extension levels (drawn in purple) priced at $0.68 and $0.72. The final level of resistance to highlight is the 1.618 Fibonacci Extension level priced at $0.79.
The technical indicators within the market are currently providing favour towards the bulls. The RSI is trading above the 50 handle indicating that the bulls are still in control of the momentum within the market. However, the recent decline of the RSI toward the 50 handle may indicate that the bullish momentum is showing signs of failure. So long as the RSI stays above the 50 handle we can expect this market to continue to make gains.


