Ripple has seen a decent 6.44% price increase over the past 24 hours trading. The cryptocurrency is currently exchanging hands at a price of $0.35 after seeing a 5.15% price hike over the last 7 days of trading.
A lot has occurred since our last Ripple update and we have updated our support and resistance levels to accommodate for this. In the past 2 months Ripple has been added to Bittrex as a base pair allowing users to exchange USD directly for XRP without having to go through the BTC pairing. Along with this, the Weiss Rating agency has called Ripple the fastest currency and is an ideal base currency for the Binacne platform.
The Ripple team have also recently started to push the narrative that the cryptocurrency is now becoming more decentralised as less than 50% of the nodes are now run by non Ripple team members.
Ripple is currently ranked at 3rd position still across the entire industry with a total market cap value of $13.90 billion. Although the markets have started to show some promising signs, the recovery still has a very long way to go after XRP loses 22% over the past 30 trading days and 43% over the past 90 trading days.
Let us continue to analyse price action for XRP over the short term.
Price Analysis
XRP/USD – SHORT TERM – DIALY CHART
https://www.tradingview.com/x/1ritIn6p/

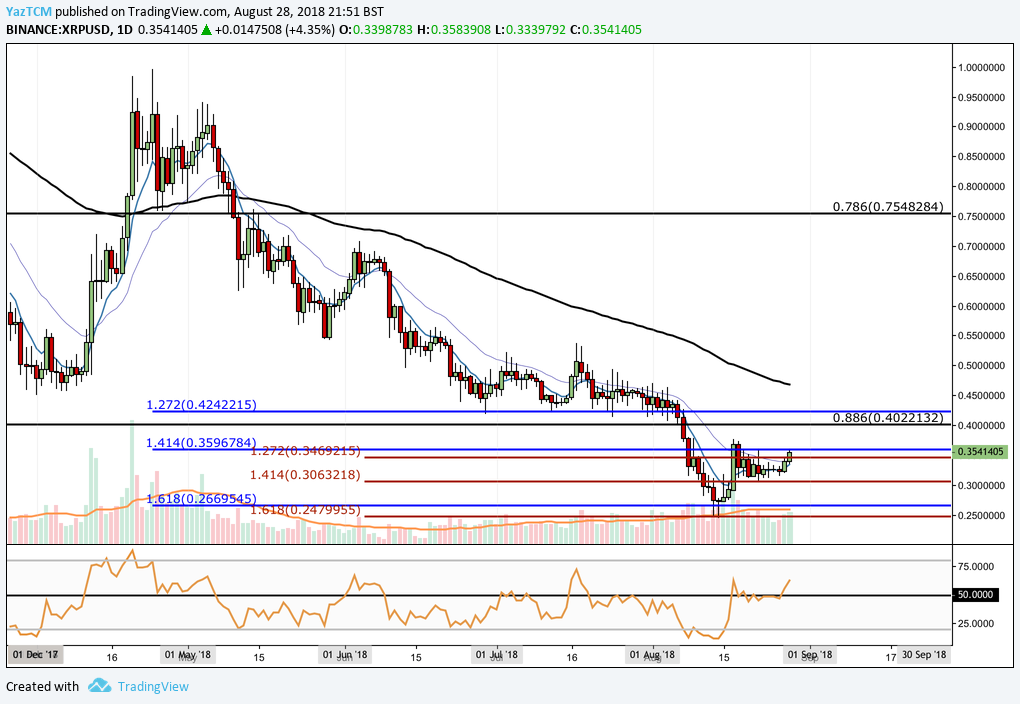
Analysing the market from the short term perspective above, we can see that the market has ahead a rough few months falling from a high close to $1 in April 2018 to a low of $0.25, recently seen during this month.
We had expected the long term .886 Fibonacci Retracement level to provide significant support to hold up the market, however, the cryptocurrency bloodbath witnessed at the start of August caused XRP to fall further lower.
We can see that, during August 2018, price action fell rapidly until support was reached at a short termed downside 1.618 Fibonacci Extension level (drawn in red) priced at $0.24. This support level was also bolstered by another slightly longer termed downside 1.618 Fibonacci Extension level (drawn in blue) priced at $0.26. This support level proved to hold strong validity as the market has recently rebounded from this area.
The market is now currently trading at resistance marked by the downside 1.414 Fibonacci Extension level priced at $0.35. If the recently experienced bullish price action can push the market above $0.35 we expect immediate resistance to be located at the previous long term .886 Fibonacci Retracement level priced at $0.40. Further significant above this level will be expected at the 100 day moving average which is currently hovering at the $0.46 handle followed by the psychological $0.50 handle.
Alternatively, any bearish pressure is expected to be supported immediately by the short term downside 1.414 Fibonacci Extension level priced $0.30 followed by the 1.618 Fibonacci Extension level priced at $0.24.
The technical indicators within the market have recently started to show signs that would bring the bulls joy as the RSI breaks above the 50 handle. This shows that the previous bearish momentum has faded and the bulls have now taken control over the market.
Similarly, the moving averages are showing signs that will soon start to favour the bulls as the moving average position themselves for a bullish crossover signal. If the 7 day EMA (blue EMA) can cross up above the 21 day EMA (purple EMA) this will produce the bullish crossover signal indicating the the bullish pressure is beginning to strongly build within the market.
Ripple (XRP) Analysis #004 – Ripple Bounces From it’s Low at $0.25; Fresh Monthly Highs Next?
Advertisement


