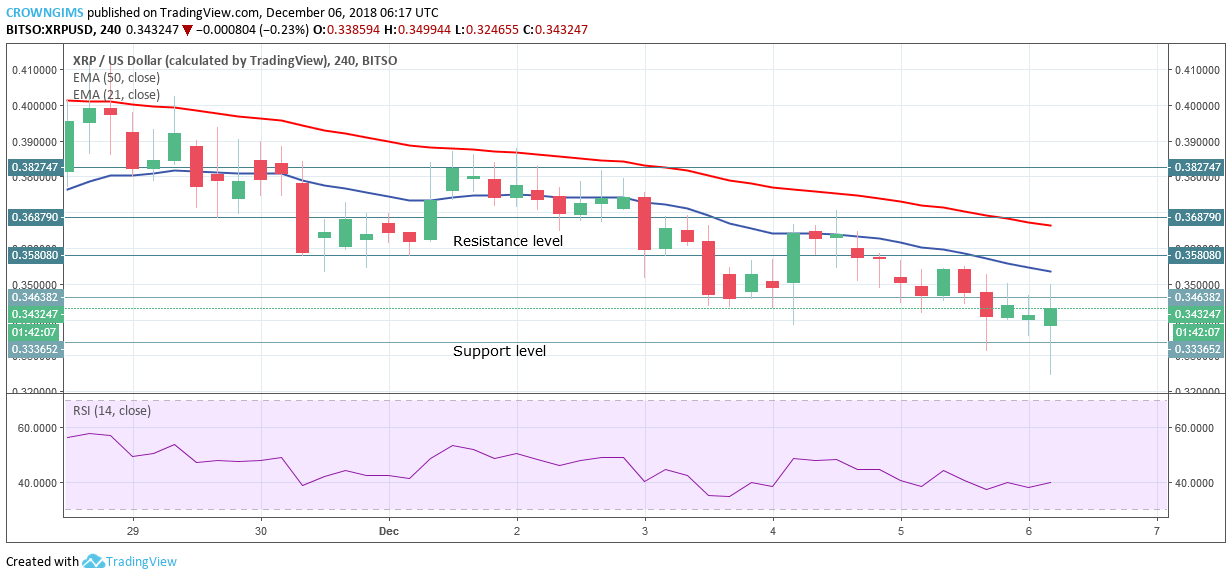
XRP/USD Medium-term Trend: Bearish

Resistance Levels: $0.34, $0.35, $ 0.36
Support Levels: $0.33, $0.32, $0.31
XRP is bearish on the medium-term outlook. The bears hold tight to the XRP market as it can be seen on the chart that the candle is making lower lows. On December 4, an attempt was made by the bulls to push the XRP price up but was resisted by the dynamic support and resistance 21-day EMA. The bears pushed the coin to break the former resistance levels of $0.35, $0.34 downside. The coin is currently facing the support level of $0.33.
The 50-days EMA remain above the 21-day EMA while the XRP price is trading below 21-day EMA with Relative Strength index at 40 levels indicating that downtrend may continue. In case the bears break the support level of $0.33, it will find its low at $0.32 – $0.31.
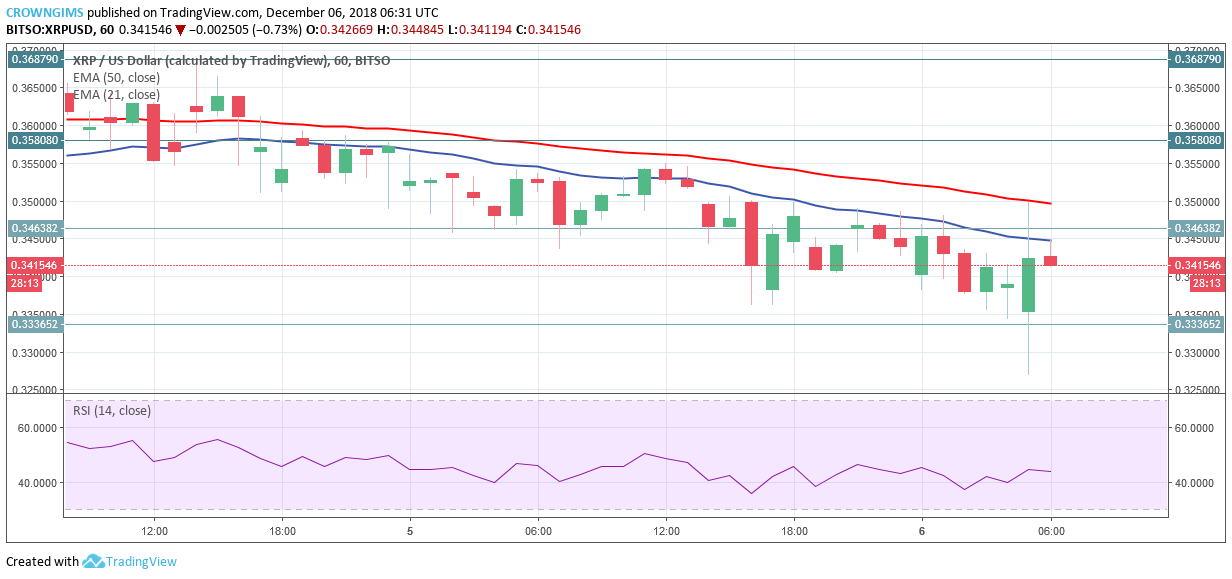
XRP/USD Short-term Trend: Bearish

XRP/USD is bearish on the 1-Hour chart. The coin continues its downtrend, though the bulls interrupted many times in order to take over from the bears, the bulls still prevailed. The cryptocurrency is below the 21-day EMA and 50-day EMA with Relative strength index above 40 levels bending down connotes sell signal.


