

November 2018 has been a depressing month for the entire cryptocurrency industry. The market collapsed as Bitcoin plunged below the long supported $6000 handle half way through the month on the brink of a hash war within the Bitcoin Cash community.
The resulting dropped saw the market cap fall from a high of $219 billion to a low of $117 billion during the month.
Let us take a look at a selection of the top coins and highlight any support and resistance moving forward.
Price Analysis
BTC/USD – SHORT TERM – DAILY CHART
https://www.tradingview.com/x/4SVzaHRp/

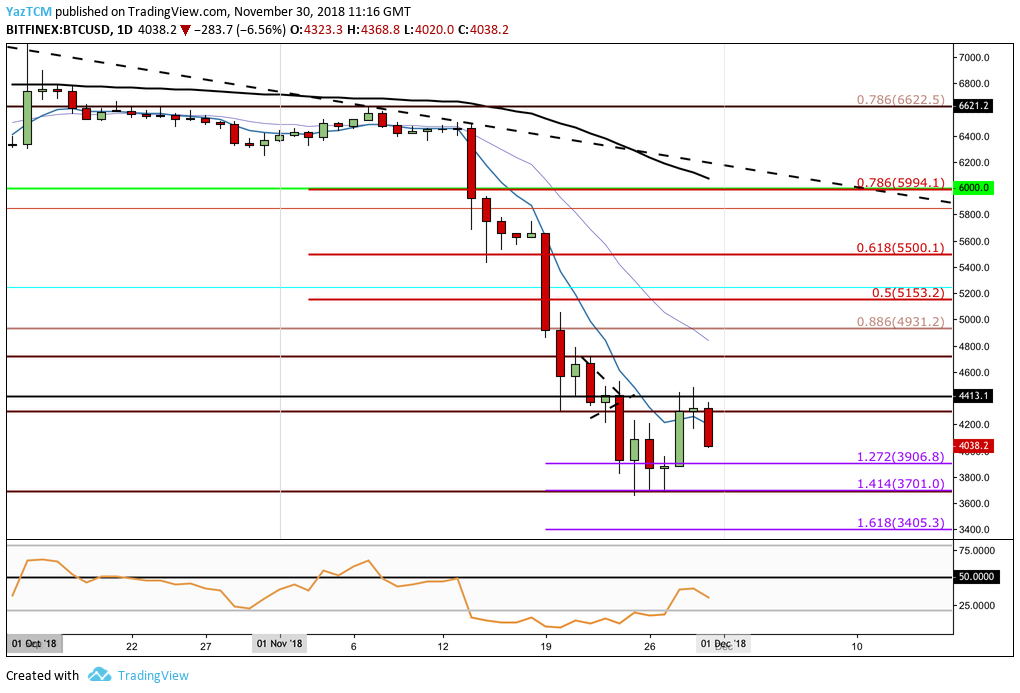
Bitcoin has seen another worrying 24 hour period as price action drops a further -8%. The market is now trading at the $4000 handle and is prime to continue further lower.
From the chart above we can see that the decline had found some form of stabilisation at a downside 1.414 Fibonacci Extension level (drawn in purple) priced at $3701. More specifically, the support was stronger at the downside 1.272 FIbonacci Extension level (drawn in purple) priced at $3906.
Price action went on to break back above $4000 after reaching this support but met resistance at the $4413 handle before rolling over again.
Looking ahead, if the decline continues we can expect immediate support below at the aforementioned short term downside 1.272 and 1.414 FIbonacci Extension levels priced at $3906 and $3701 respectively. If the selling pressure continues further lower we can then expect more significant support beneath to be located at the downside 1.618 Fibonacci Extension level priced at $3405.
Alternatively, if the buyers can hold at $4000 and begin to climb higher again we can expect resistance at the $4413 handle. Resistance located above this can then be expected at the $4800 handle followed by the long term Fibonacci Retracement level priced at $4931.
The RSI has risen up from extreme oversold conditions over the past few days but failed to break above the 50 handle. This indicates that the bears are still in control and more selling pressure may still be incoming.
ETH/USD – SHORT TERM – DAILY CHART
https://www.tradingview.com/x/Dy0CrpOT/
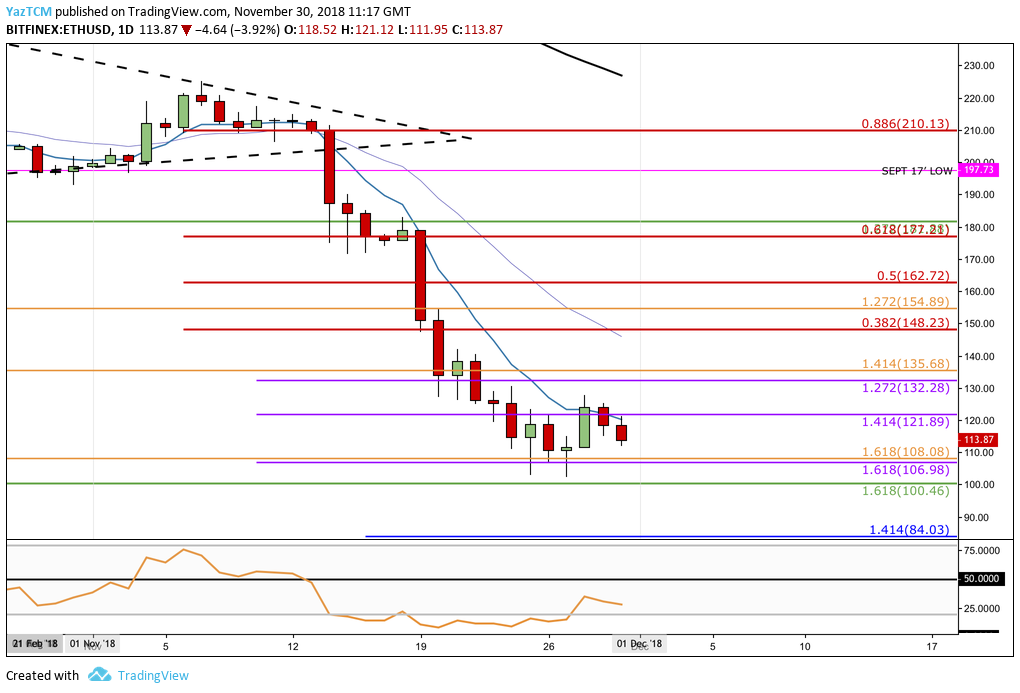
Ethereum has also seen a -7.49% price decline over the past 24 hours of trading. The cryptocurrency is currently exchanging hands at a price of $112 and has seen a rough 30 day trading period where price action dropped over 42%.
We can see that the market downtrend had found support at a combined area of 2 downside 1.618 Fibonacci Retracement levels priced at $108, before reversing. The market then rose into resistance at the $121 handle before rolling over once again.
Looking ahead if the selling pressure continues we can expect immediate support below to be located at the combined support at $108. Further support located below this can be found at the long term downside 1.618 Fibonacci Extension level (drawn in green) priced at $100. If the bears break beneath the $100 handle we can then expect further support below to be located at the short term downside 1.414 FIbonacci Extension level (drawn in blue) priced at $84.03.
Alternatively, if the bulls can regroup and begin to climb once again the initial resistance will be located at the $121 handle. If they can press further higher we can expect more resistance to be provided by the previous downside 1.272 FIbonacci Extension level (drawn in purple) priced at $132 followed by the bearish .382 Fibonacci Retracement level (drawn in red) priced at $148.
The RSI within this market is still trading in the bearish territory as it remains underneath the 50 handle. If the RSI heads further lower we could see ETH break back below $100.
XRP/USD – SHORT TERM – DAILY CHART
https://www.tradingview.com/x/cZpxtrdK/
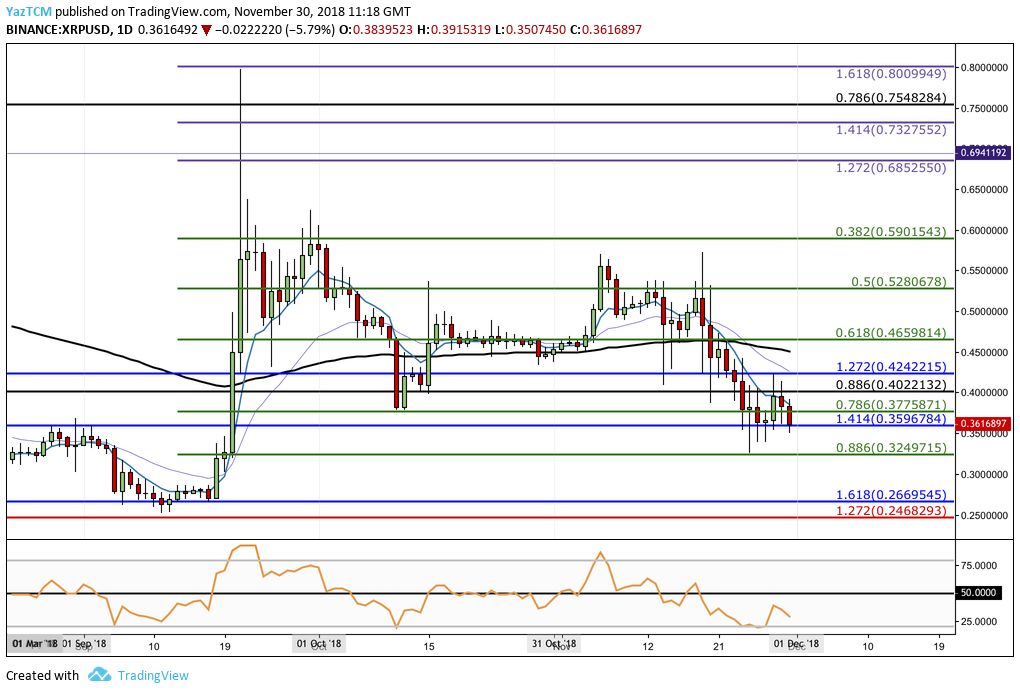
Ripple has seen a price drop also totalling -8% over the past 24 hours of trading. The market is now exchanging hands at a price of around $0.3561 as it remains ranked in the second position in overall market cap value. The market has seen a turbulent 7 day period where prices dropped by -13% as the 64 month old project trades at a value that is 90% lower than its all time high price.
We can see that the decline for Ripple during November was not as severe as the rest of the market. This is due to XRP/BTC continued rise helping reduce the decline in the USD value.
We can see that the market has dropped toward the support at the short term .886 Fibonacci Retracement level (drawn in green) priced at $0.3249. Price action is now trading at support provided by the downside 1.414 Fibonacci Extension level (drawn in blue) priced at $0.3596.
Looking ahead, if the bearish sentiment causes XRP/USD to break below $0.3596 we can expect immediate support below to be located at the short term .886 Fibonacci Retracement previously mentioned at $0.3249.
If the sellers continue further below this support level we can expect more support beneath to be located at the downside 1.618 Fibonacci Extension level (drawn in blue) priced at $0.2669.
The RSI has returned towards a downward facing position which indicates that the bears are still in complete control within the market.
XLM/USD – SHORT TERM – DAILY CHART
https://www.tradingview.com/x/FL4jytIV/
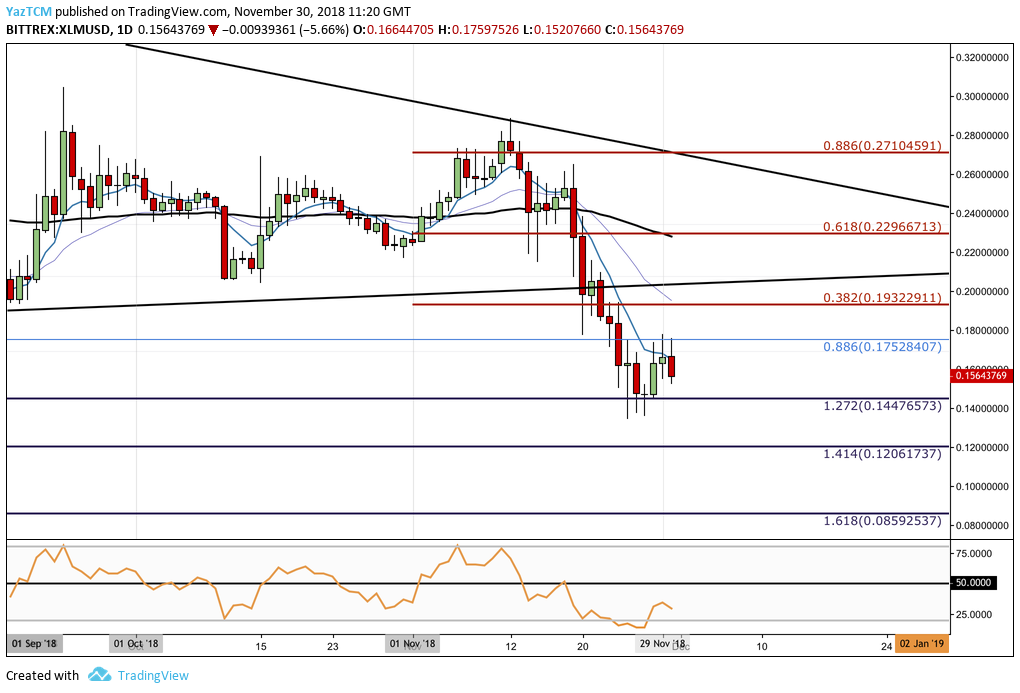
Laments has also seen a -8% drop in price over the past 24 hours of trading as it now is exchanging hands at the $0.1558 handle. The market has seen a -14.51% price drop over the past 7 trading days and -29% over the past trading month.
We can see that, during the November market collapse, XLM had found support at a downside 1.272 Fibonacci Extension level priced at $0.1447 before rebounding. Price action then went on to rise into resistance provided by the long term .886 Fibonacci Retracement level (drawn in blue) priced at $0.1752 before reversing lower once again.
Moving forward, if the selling pressure continues we can expect immediate support below to be located at the $0.1447 handle. If the sellers continue below this level wwe can expect more support beneath to then be located at the downside 1.414 FIbonacci Extension level priced at $0.1206.
Alternatively, if the buyers can push price action above the resistance at $0.17 they will encounter higher resistance at the bearish .382 and .618 Fibonacci Retracement levels (drawn in red) priced at $0.1932 and $0.2296, respectively.
The RSI is also pointing in the downward direction which indicates that more selling pressure is on the horizon.
TRX/USD – SHORT TERM – DAILY CHART
https://www.tradingview.com/x/YvhjXkve/
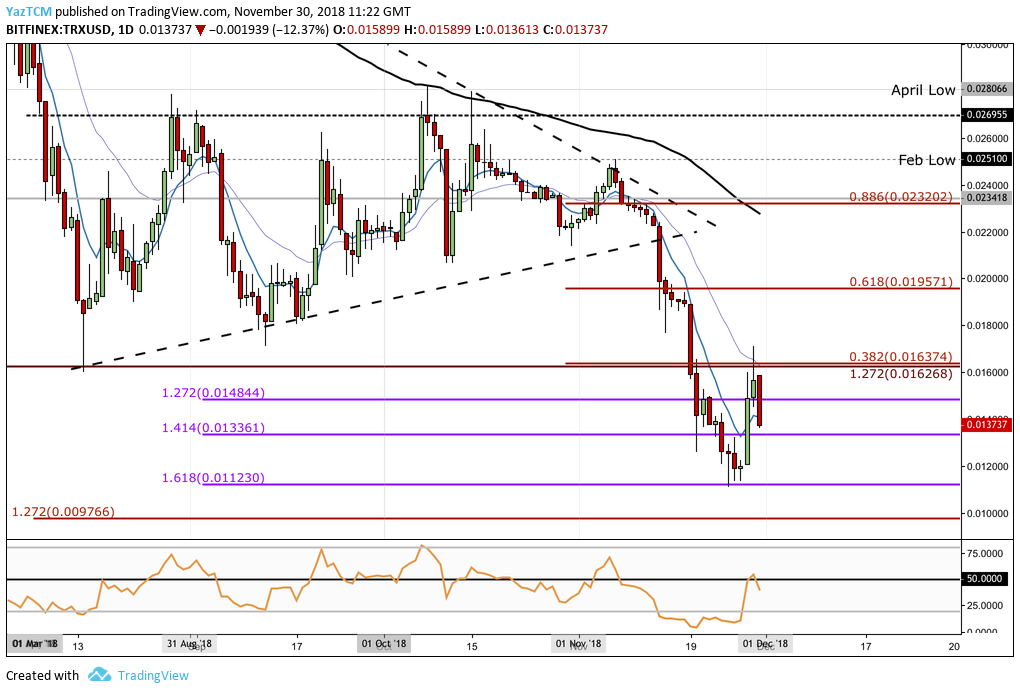
Tron is the worst performer on this list losing a total of over -15.1% over the past 25 hours of trading. The market is now trading a price around $0.013 after suffering a -38% price drop over the past trading month. Tron is now ranked in 12th position with a total market cap value of around $900 million.
Looking at the chart above, we can see that the decline during November had found support at a downside 1.618 Fibonacci Extension level (drawn in purple) priced at $0.01123. Price action rebounded from this level but found resistance around $0.016 before dropping again.
Moving forward, the selling pressure looks like it is reaching support at the downside 1.414 FIbonacci Extension level (drawn in purple) priced at $0.01336. If the sellers continue to break further lower we can then expect more support below to be located at the downside 1.618 Fibonacci Extension level (drawn in purple) priced at $0.01123.
If the market falls beneath the psychological support at $0.010 we can then expect further support below to be located at the medium termed downside 1.272 Fibonacci Extension level (drawn in red) priced at $0.009766.
On the other hand, if the buyers regroup and begin to push the market higher again we can expect immediate resistance at the $0.016 handle. If they successfully manage to break above $0.016 we can then expect more resistance at the short term bearish .382 and .886 Fibonacci Retracement levels (drawn in red) priced at $0.01957 and $0.02320 respectively.
The RSI had managed to return to the 50 handle within this market but has recently penetrated back below as the sellers re-enter their positions. If the RSI continues to head further lower we could see Tron creating fresh new all time lows once again.


