

Supply zones: $0.30, $0.31, $0.32
Demand zones: $0.28, $0.27, $0.26
XRP/USD Medium-term Trend: Bearish
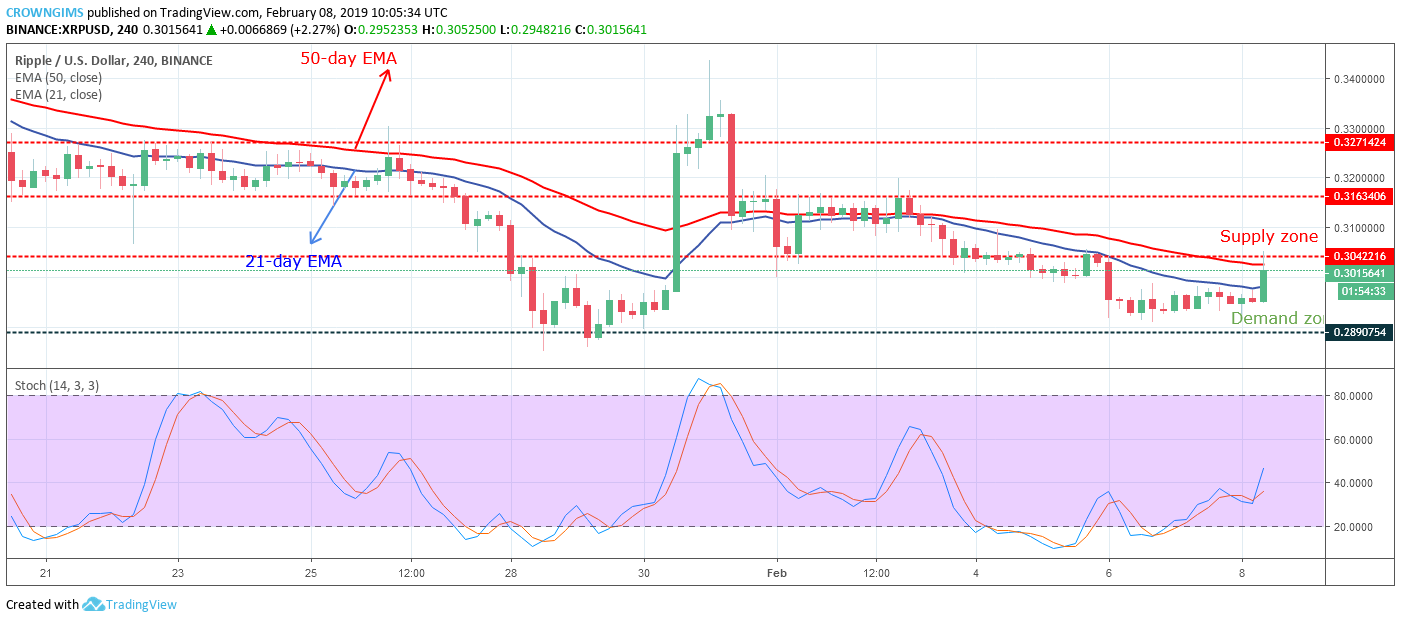
Bearish trend continues in the XRP market on the medium-term outlook. The bearish momentum bottomed the coin at the demand zone of $0.28 on January 29; the inside bar candle pattern formed at that level propelled the cryptos to the highs above the supply zone of $0.32 after broken up the supply zones of $0.30, $0.31, $0.32 on January 31.
The evening doji star candle formed, which is a trend reversal candle and the XRP price fell to the previous low price level of $0.28 after the break down of many psychological barriers. The price is currently increasing towards a $0.30 price level.

The breakup of $0.30 supply level is highly envisaged as the strong bullish candle is emerging from the consolidation zone and the coin is trading between the 21-day EMA and 50-day EMA and also the Stochastic Oscillator period 14 is at 40 levels with the signal lines pointing up which implies buy signal.
In case the bulls defend the demand zone of $0.28, XRP price will rally towards $0.31 – $0.32 supply zone provided the $0.30 price level break upside.
XRP/USD Short-term Trend: Bullish
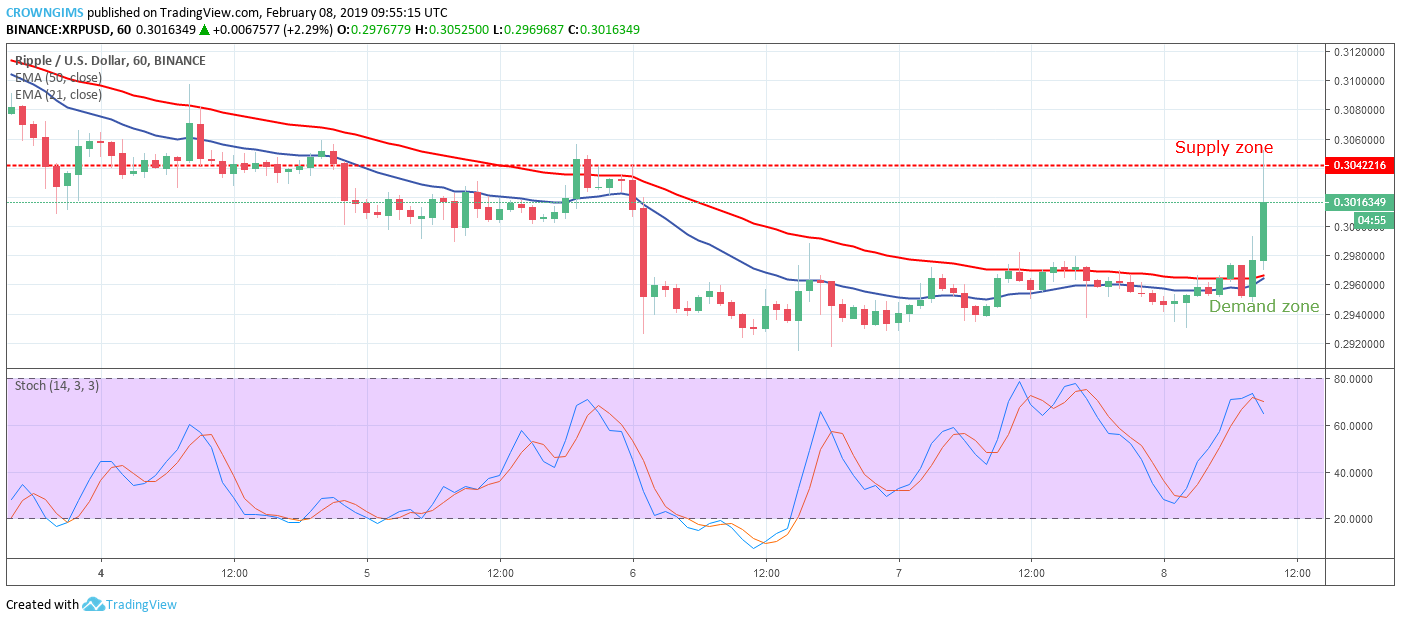
XRP/USD is on the bearish trend on the medium-term outlook. On the 4-Hour chart, XRP price reached the supply level of $0.30 on February 5, it was resisted by the bears and bearish harami candle formed which prevented a further price increase. XRP price descended towards the demand zone of $0.28 and commenced another sideways movement.
The XRP price is currently breaking out of the consolidation zone rallying towards the supply zone of $0.30 and the bears are trying to pull the price back, which is clearly seen on the upper long wick bullish candle.
XRP is above the two EMAs with 21-day EMA below 50-day EMA which indicates that the bulls are moving into the XRP market with full force. However, the Stochastic Oscillator period 14 is at 70 levels and the signal lines point down which connotes sell signal.


