

Stellar (XLM/USD)
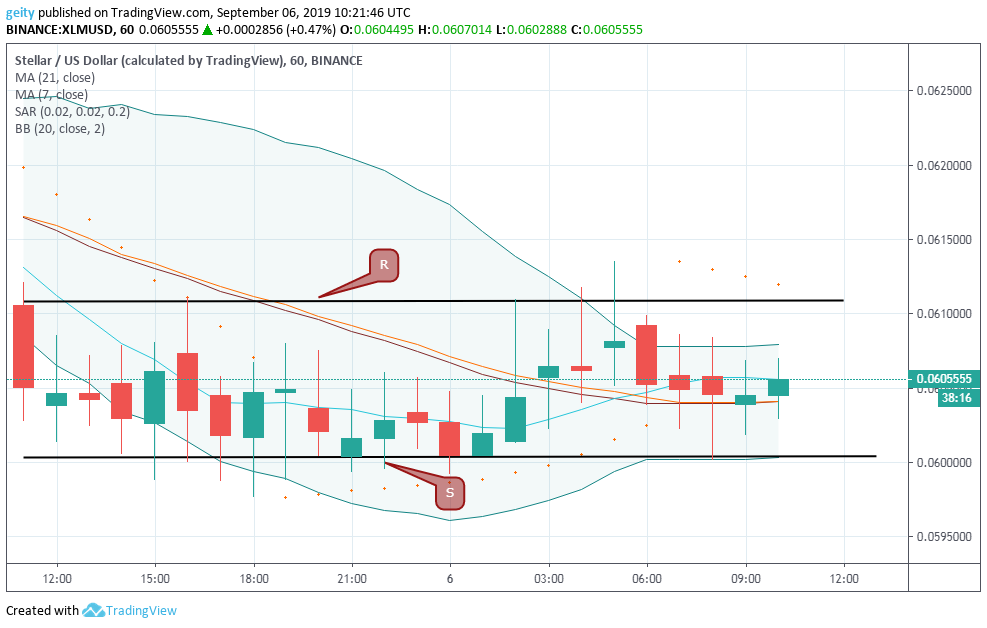
XLM/USD pair has been on a sideways move over the last 24hrs. The formation of horizontal channels that also acted as support and resistance level that is at $0.0600 and $0.0612 validated the sideways trend. The pair’s price escalated from the opening price of $0.0605 to $0.0606 that showed a slight gain by 0.7% over the intraday.
Notably, both significance levels (support and resistance level) were tested in several instances. Additionally, the long-term SMA hovered above the short-term SMA at most of the time that signified intense selling pressure. However, the slight recovery might not continue since at the moment the Bollinger band has contracted that shows a low level of volatility; thus, a reduction in investor’s positive sentiments.
Forecast
A downside breakout is likely since most indicators signal an incoming bearish outlook. The parabolic SAR is above the candles that give a negative sign.
Cardano (ADA/USD)
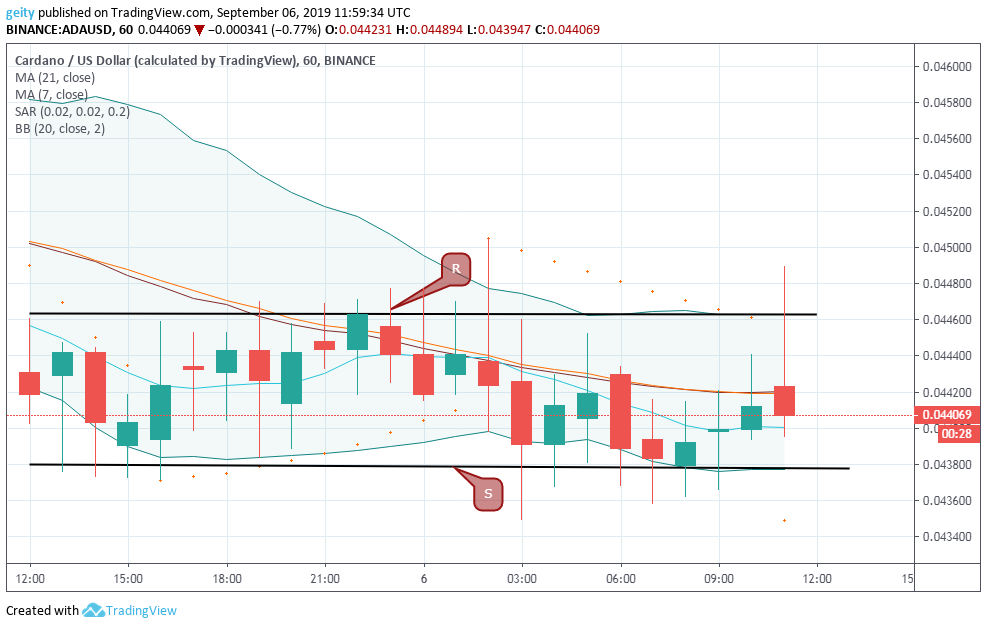
ADA/USD pair has also faced a mixed reaction over the last 24hrs. The tremendous decline that was encountered two days back is now correcting losses today between $0.0438 (S) and $0.0446 (R) levels. There were several attempts to breach both support and resistance level that suggested an equal and indecisive market condition. Afterwards, the price escalated from $0.0444 and is now changing hands at $0.0441.

Additionally, the long-term SMA that has been gravitating above the short-term SMA, throughout the intraday suggested a bearish sign. The Bollinger bands are now beginning to expand, showing an increase in volatility.
Forecast
At the press time, the parabolic SAR is below the candle, and the Bollinger band is gaining some volatility that signifies incoming bullish sign. Additionally, ADA coin was launched back in September 2017. Which means that this September is ADA’s second anniversary that may record positive changes. An upward rally near $0.0500 is anticipated that is if the bulls manage to break above $0.0446.
Bitcoin (BTC/USD)
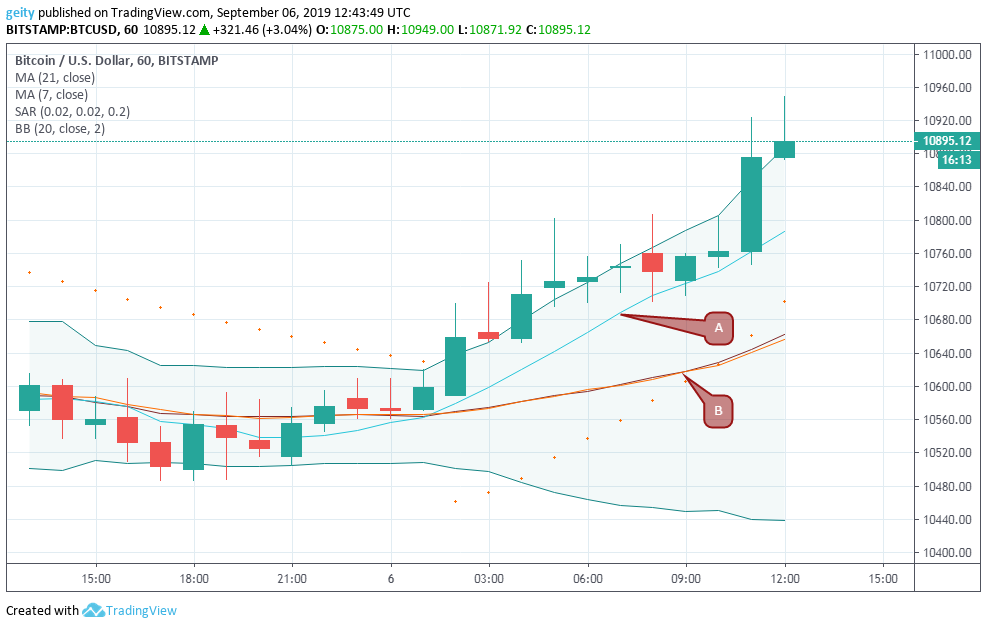
BTC/USD pair, on the other hand, has impressively performed. The coin gained momentum by almost 3% over the last 24hrs, having moved from $10601.17 to $10895.12. However, before the upside breakout, the price of BTC/USD pair corrected gains between $10498.12 and $10596.88. The upside move was reflected by the Bollinger bands, which are expanding. That also confirmed a period of high volatility level; thus, high interest in higher price levels.
The bullish pressure also gained support from the short-term SMA (A) that is now above the long-term SMA (B). The parabolic SAR is also below the candles that also suggested a bullish sign. Notably, investor’s sentiments are likely to increase due to an increase in buying pressure.
Forecast
A further upward rally is likely since most technical indicators foreshadow a positive move. However, a short-term consolidating period between $10340.00 and $10520.00 is expected before a breakout.
Disclaimer: The views and opinions expressed here are solely those of the author and do not necessarily reflect the views of ZyCrypto. None of the information you read on ZyCrypto.com should be regarded as investment advice. Every investment and trading move involves risk, you should always conduct your own research before making any investment decision.


