
 Technical Analysis #001 - OMG Falls Below $6; Can the Bulls Stop It Dropping Further")
OmiseGO has experienced a 4% price decline over the past 24 hours of trading. The cryptocurrency is currently exchanging hands at $5.96 but has suffered a significant 16.20% price drop over the past 7 trading days.
OMG was created by its parent company Omise, which was founded by CEO Jun Hasegawa, whom had worked for google for over 16 years before starting Omise. Omise is a company that is dedicated toward payment solutions throughout South East Asia.
As there are many actors within the region, sending finance cross borders can be a troublesome affair. This is due to diffeferent banks using different processes and the level of paperwork and documentation required for users, which is not always possible in this part of the world.
The cryptocurrency aims to be an extremely user friendly platform and has proven that it can achieve this. Along with this OMG plans to solve the scalability issues seen with other cryptocurrencies by implementing the Plasma technology developed by Joseph Poon.
Poon had worked closely with Vitalik Buterin to develop the technology. Poon had also worked with OmiseGo to write their white paper. Vitalik Buterin, the founder of Ethereum, also serves as an advisor to OmiseGo, adding multitudes of experience to the project.
OMG is currently ranked at 21st position in terms of overall market cap across the entire industry with a total market cap value of $835 million.
Let us continue to analyse price action over the long term.
Price Analysis
OMG/USD – LONG TERM – DAILY CHART
https://www.tradingview.com/x/7tF6N3D6/
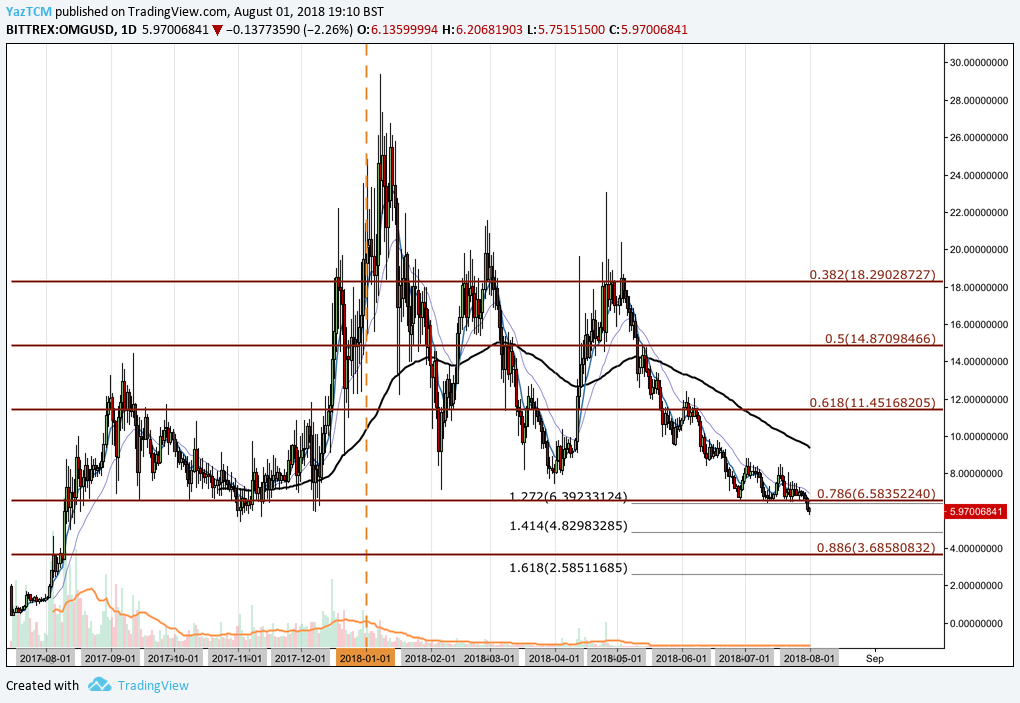
Analysing the market from the long term perspective above, we can see that OMG had started a bullish run since it was added to BitTrex. It began from a low price of $0.36 on July 16th 2017 and increased to an all time high priced at $29.37 on January 8th 2018. This was an epic price increase totalling 6900% from low to high.
After placing this all time high, the market went on to decline. It initially found support at the .5 Fibonacci Retracement level priced at $14.87 during January 2018. This is a Fibonacci Retracement measured from the bullish run outlined in the paragraph above. However, the market failed to hold this level and began to fall further.
The market has been up and down for the majority of the year, never being able to test the all time previous high. When June started to trade, price action fell to the lowest price so far for the year as it hit support at the .786 Fibonacci Retracement level priced at $6.58.
This Fibonacci Level had provided ample support throughout June and the majority of July. However, toward the end of July we can see that the market fell below the .786 Fibonacci Retracement to continue to make fresh yearly lows.
Let us continue to analyse price action a little closer over the shorter period to highlight any potential support and resistance zones.
OMG/USD – SHORT TERM – DAILY CHART
https://www.tradingview.com/x/gDLGzoID/
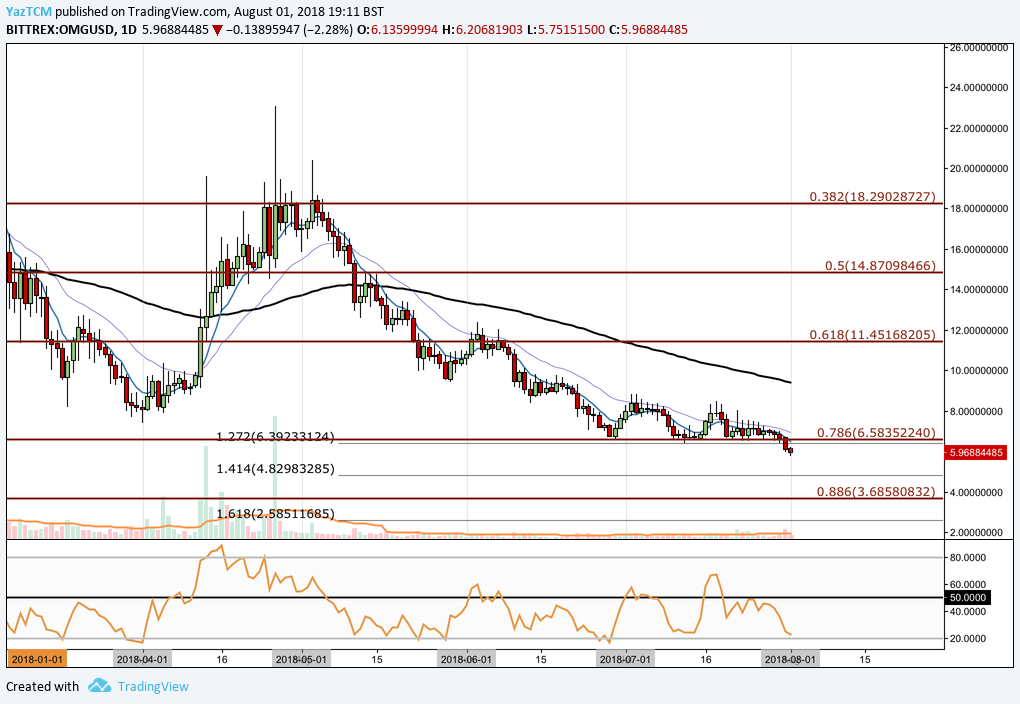
Analysing the market from the shorter perspective above, we can see that OMG had experienced a smaller bullish run during April as price action started from a low of $7.40 on the 1st of the month and extended to a high of $23.06 on April 26th 2018. This was an overall price increase totalling 205% from low to high.
However, in the following two months, May and June, price action continued to deteriorate and eventually fell below the initial starting point of the bullish run outlined above. We can see that during July the market had found support at the .886 Fibonacci Retracement priced at $6.58.
This level of support was expected to hold due to it being bolstered by a downside 1.272 Fibonacci Extension level priced in the same area, adding to the expect support in the are. However, toward the end of July we can see that the market slipped further below $6 at where it is currently trading.
As the bearish pressure continues we expect immediate support to be located at the downside 1.414 Fibonacci Extension level priced at $4.82 followed by the psychological round number level $4. Further support below this can be found at the long term .886 Fibonacci Retracement level priced at $3.68.
Alternatively, if the bulls can re-enter the market we expect near term resistance to be immediately located at previous support marked by the .786 Fibonacci Retracement priced at $6.58. Further resistance above this level is expected at the 100 day moving average which is currently hovering around the $9.50 handle.
The technical indicators within the market are heavily learning toward favouring the bears as the RSI trades well below the 50 handle close to oversold conditions. If we are to expect the bullish momentum to pick up we would need to see the RSI make its way back toward the 50 handle and eventually break above it.
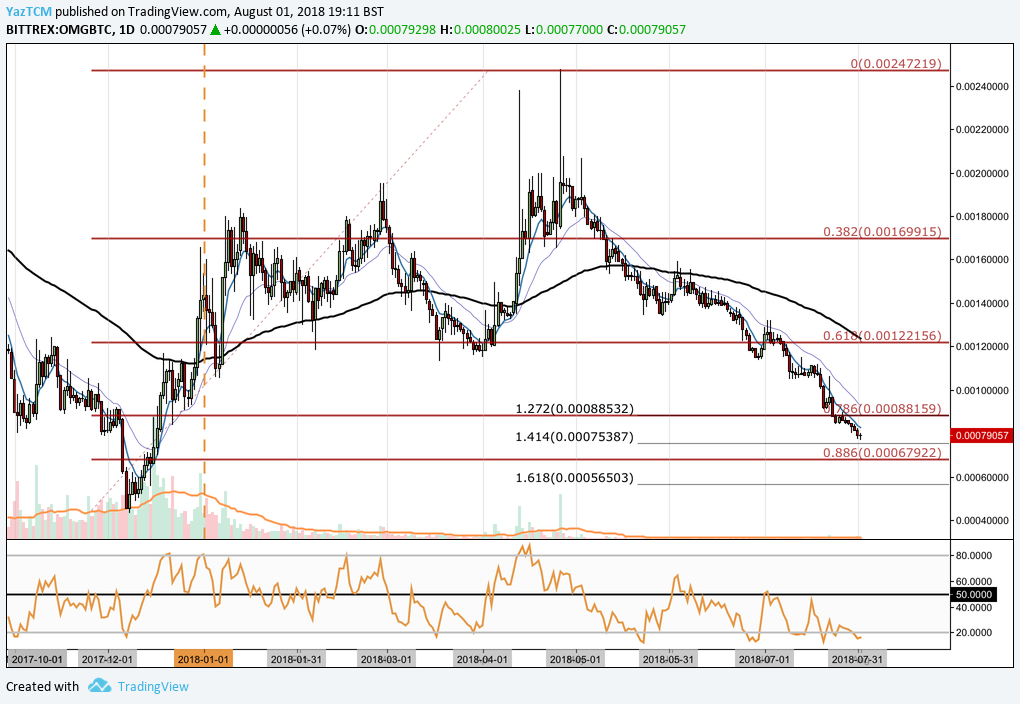
https://www.tradingview.com/x/BibYveOU/
, and Stellar (XLM) Price Analysis – Recovery Expected Above Major Support Levels")
 and Stellar (XLM) Weekly Price Performance Overview")
