The price of Bitcoin has been quite indecisive for the past 3 days as the bulls are currently trying to set a daily higher low. The bulls have experienced two fakeouts already, however, the bears are not getting any kind of continuation afterward either.
The bulls are trying to break above the 12-period EMA on the daily chart, however, the 4-hour chart is key now. The bulls need to set an uptrend on the 4-hour chart in order to confirm a daily higher low. The daily trading volume continues to decrease but the MACD has turned bullish on the daily chart.
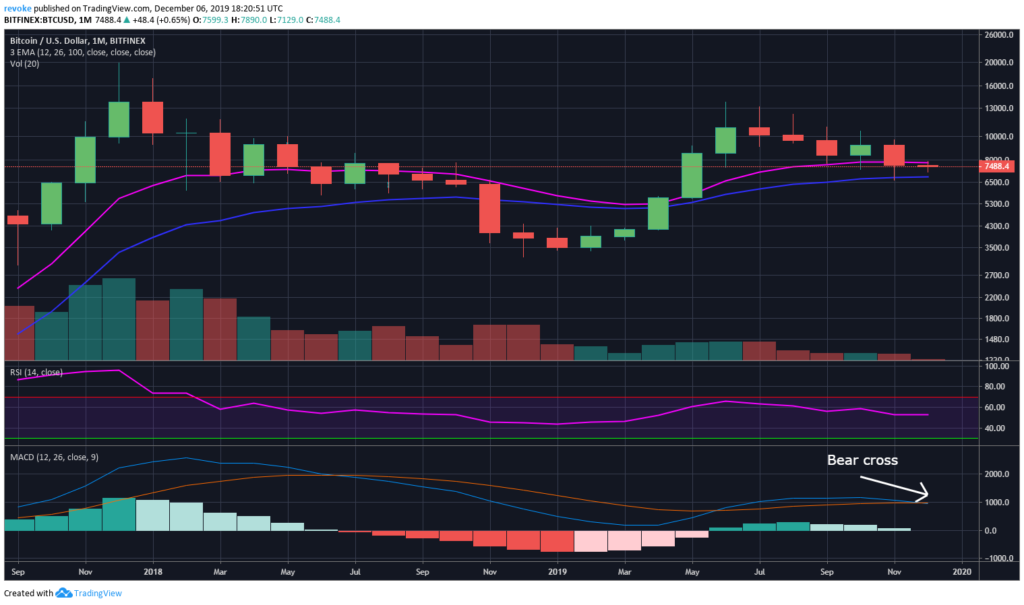
Monthly MACD Turns Bearish for the First Time in 1 Year and a Half
The monthly MACD has turned bearish, however, it will not be confirmed until the end of the month or until a massive and decisive crash. According to Omkar Godbole, the bearish MACD cross is not necessarily as bad as some investors might think.
Omkar also mentions that there are a few signs of seller exhaustion, for instance, shorts on Bitfinex remain really low even though Bitcoin has been in a downtrend for quite some time now.

The MACD is a lagging indicator, which means it’s not exactly the best to predict upcoming market moves. The last time the MACD crossed bullishly was back in June when Bitcoin was already almost at the top of the bull move to $13,700. If a trader used that bull cross as an indicator to buy, he would have lost a lot of money as Bitcoin started its downtrend a month later.
Clearly, the MACD is not the best indicator to predict the future. Trading volume, however, can indicate when a digital asset is close to a break, whether it is to the upside or downside.
Bitcoin Trading volume was increasing fast during the first half of 2019, however, it has been slowly deteriorating on almost all exchanges. This indicates that a big move is close to happening but might still take a few more months before it materializes.


