

Litecoin (LTC/USD)
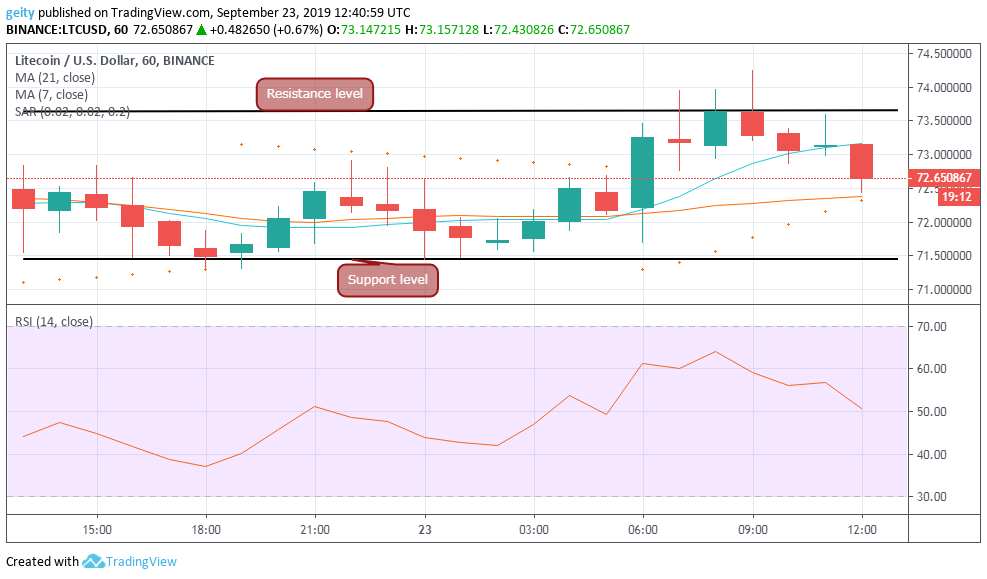
Looking at the hourly chart, the movement of the LTC/USD pair has slowed down with an intraday gain of 0.61%. The price shifted from $72.2085 that was followed by a sideways move above the critical support level being seen near $71.4611.
At around 06:00, the market showed a high interest of higher price levels that led to a hike, which tested the critical resistance level at $73.6377 before dropping slightly to the current value at $72.6509.
The short-term SMA that is above the long-term SMA signals a hint for an incoming bullish move. The RSI that is above average and the parabolic SAR that is below the candles give a buy signal. Thus, investor’s sentiments are likely to improve shortly.
Outlook
An upside correction above the critical resistance level $73.6377 could perhaps result in an upward price rally near $80.0000 and $81.0000.

EOS/USD
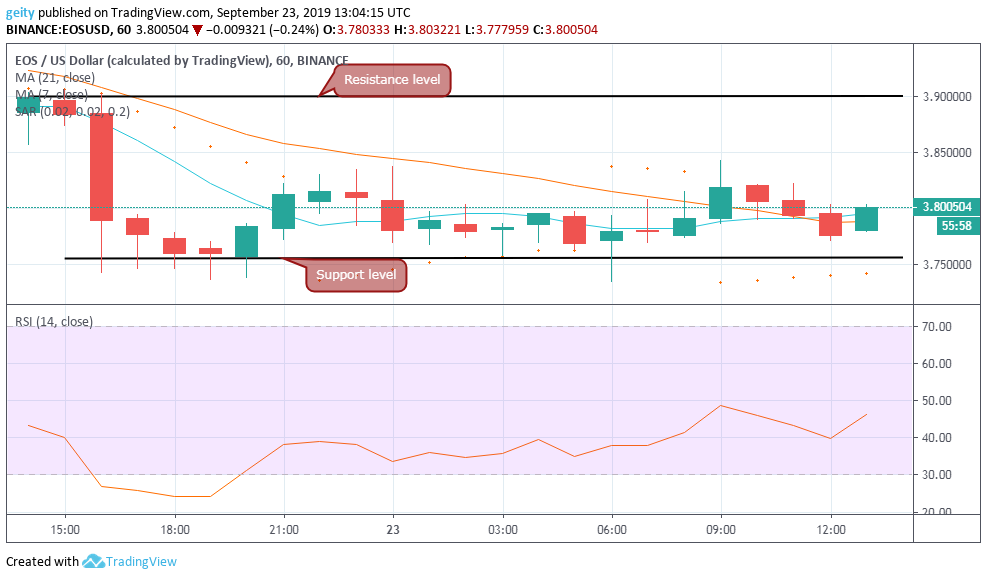
Unlike LTC, EOS/USD pair has given a bearish mode, having swayed down by 2.5%. EOS/USD pair escalated from $3.8988 to the closing price of $3.8005. Besides, most moves have reflected a downside pressure, starting with the long-term SMA that hovered above the short-term SMA.
Afterward, EOS/USD pair first saw a sharp drop to a low of $3.7423 that later took a break to test significant support that was found near $3.7561. The price recovery is now seen as reflected by the parabolic SAR that is below the candles that give investors a buying alarm and the RSI that has been trading near the oversold zone that suggests a negative outlook.
Outlook
There could be a turnaround for the bears since most indicators foreshadow a bullish scope.
Binance Coin (BNB/USD)
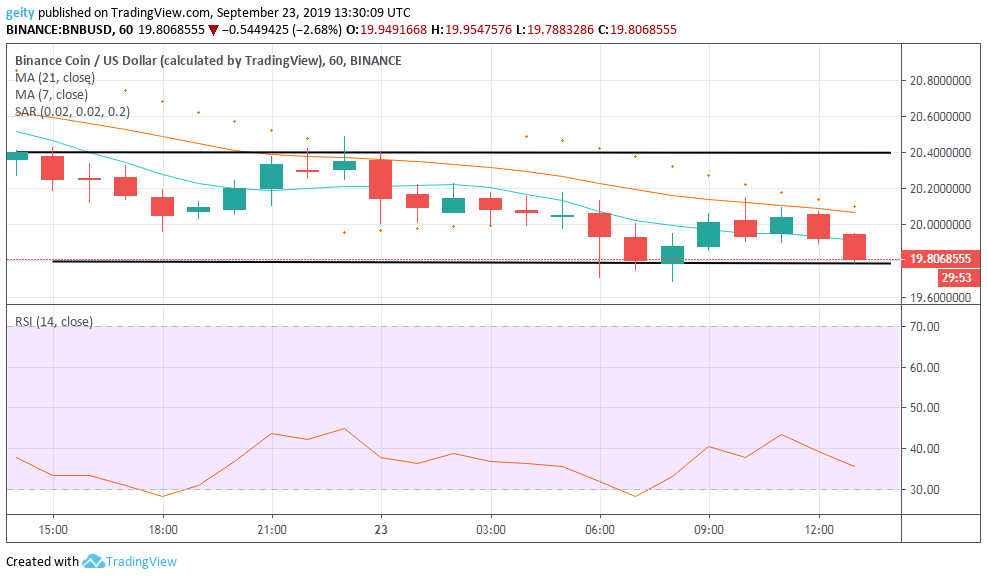
BNB/USD pair has also exhibited a sideways move as reflected by the horizontal channels. However, BNB has recorded a slight drop by 2.9% over the intraday, having shifted from $20.3992 to $19.8069.
The currency has given a beatable outlook with the long-term SMA above the short-term SMA. Afterward, resistance level and support level was defined near $20.4120 and $19.8024.
Followed by a struggle to breach $19.8024, if the bulls do not regain their strength, a downside correction is likely. Also, the parabolic SAR is above the candles that recommend investors to take a short position. The RSI is also pointing south that gives a negative sign.
Outlook
There is a high chance for downside correction with BNB seen dealing at $17.5000. Conversely, on the brighter side, if the bulls strengthen their move and push the price above $20.3992, it may trigger further up climb near $21.0000.
Every Crypto Trading and Investment Activities Involve Risk. This Article Is Provided For Informational Purposes Only And Shouldn’t Be Taken As Finance Advice.

