
 And XRP Price Analysis and Prediction")
LTC-USD
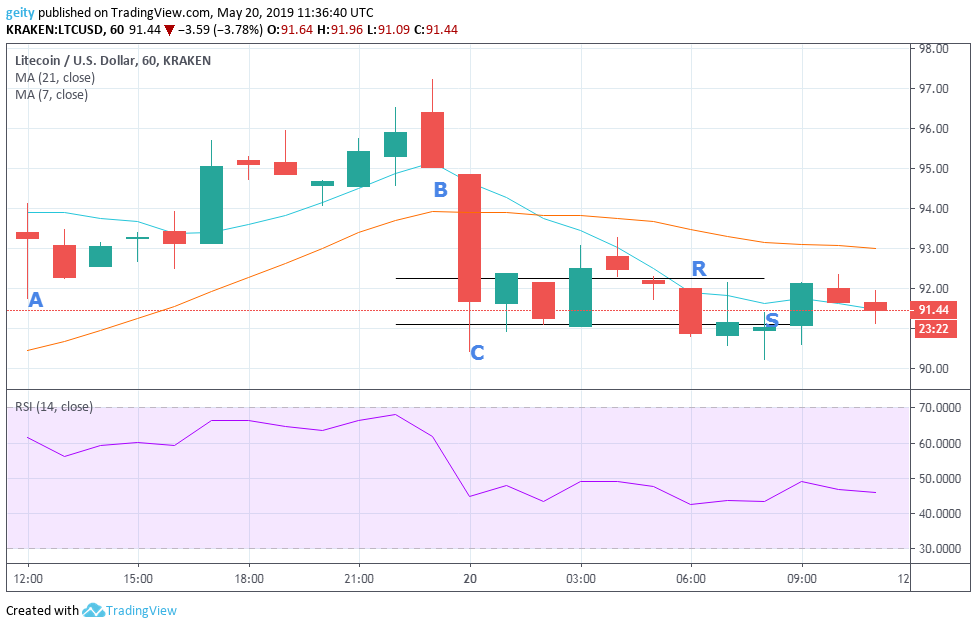
Despite a generally bearish outlook in the last 24hrs, the day began with A bullish momentum. This was buttressed by the 7 day MA that was seen above the 21 day MA indicating a bullish signal. LTC/USD pair started trading at $93.26 (A) whereby the bulls managed to push the price rally up to a high of $96.52, despite that indecision of the market was encountered on several occasions during that period of time.
Later on, an engulfing pattern emerged that dip the price to close at $95.03 (B) but it was then further dropped to a low of $91.67 (C). This was followed by the 21 day MA that crossed over the 7-day MA resulting to a bearish rally.
Resistance level (R) was placed at $92.52 and support level (S) was at $91.10. Both resistance and support zones where breached and tested. LTC is currently trading at $91.44 thus shows a dip in price, the RSI confirms the downtrend since is seen below 50 during the last few hours.
FORECAST

The 21 day MA is still above the 7-day MA thus indicating a bearish signal. The RSI is also heading north this shows that the falling price rally is likely to be seen in the next few hours. New target should be set at $90.83.
BCH-USD
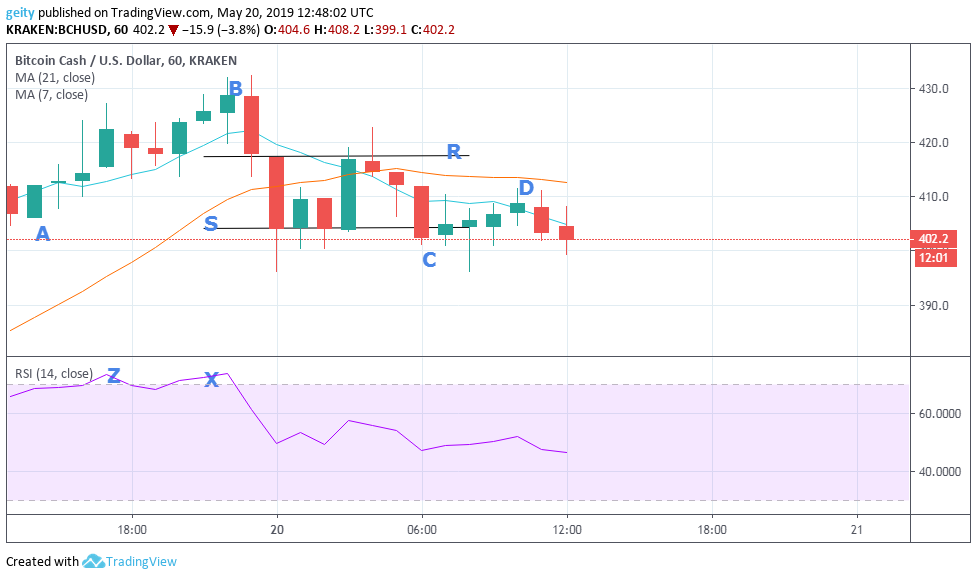
The day began with an uptrend; this was confirmed by the 7-day MA that is seen above the 21 day MA indicating bullish momentum. BCH started trading at $412.1 (A) but later on, the bulls pushed the price up to close at $428.6 (B) indicating that the bulls had the upper hand thus a selling area. The RSI at Z and X is seen above 70 indicating an overbought market during that period of time. TThe bears later pushed the price down to a low of $413.5 and then further down placing support level at $404.3 and resistance level at $417.6. Later on, the 21-day MA crossed over the 7-day MA resulting in a downwards price rally.
Just like LTC/USD pair, support and resistance level of BCH/USD was also tested severally. BCH is now trading at $402.2 this also shows a dip in price momentum thus little demand from traders.
FORECAST
The 21-day MA is still seen above the 7-day MA this shows that a downtrend is likely to continue in the next few hours. New target should be set at $390.1, traders should also prepare to go long at $409.1 and place a stop-loss above or below $409.1.
TRX-USD
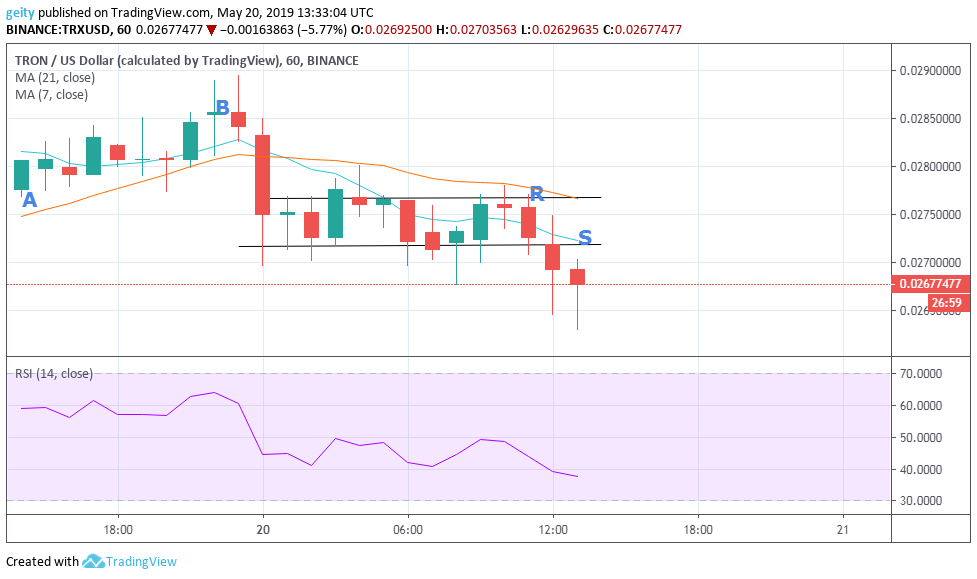
A bullish market is observed at the beginning of the day. TRX began trading at $0.02806 (A) but later on the bulls pushed the price up to a high of $0.02889. This was buttressed by the 7-day MA that was seen above the 21 day MA indicating bullish momentum.
The bears later pulled up their socks and pushed the price rally further down to a low of $0.02695. The 21-day MA later crossed over the 7 day MA indicating a bearish signal. This was followed by a sideways price rally that placed support level at $0.02718 and resistance level at $0.02766.
Both support level and resistance levels were tested and breached. TRX is currently trading at $0.028563 and just like Litecoin and Bitcoin cash, Tron has also dipped 2%.
FORECAST
The appearance of a reversal candlestick (hammer) in the last hour indicates an upward price rally is likely to occur in the next few hours.
The RSI is heading north this shows that a downtrend is likely to continue. New target should be set at $0.02693.


