
 and EOS")
Litecoin (LTC/USD)
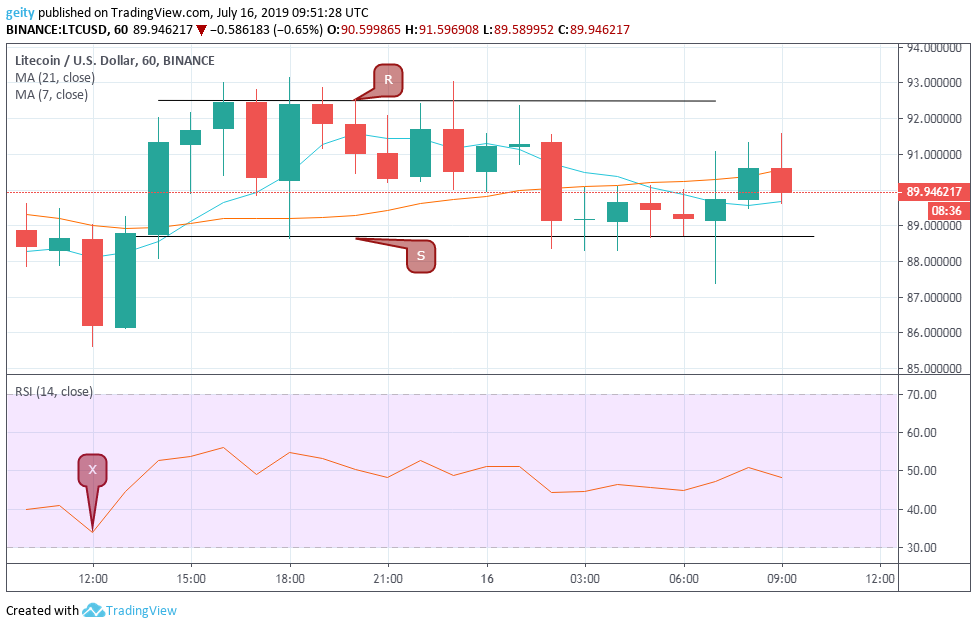
LTC/USD pair underwent a bullish medium-term outlook over the past 24hrs. LTC has slightly upsurged by $1.73% since it began the sell-off yesterday at $88.3919 and is currently trading at $89.94. The pair’s price dipped sharply yesterday to a low of $85.60 before gaining track.
This was reflected with the RSI indicator X that dipped to a low of 33.91 and later climbed up to a high of 56.89. An outbreak followed that shifted the price momentum up to a high of 93.0273. A sideways price momentum was then seen as reflected by the Relative Strength Index indicator that was later seen hovering between the level 40 and 60.
Resistance level was placed at $92.49 and support level at $88.70. Indecision in the market was also seen due to the presence of intertwining moving averages. The RSI is at the moment tending towards the south that showed that sellers had dominated the market momentum.
Forecast
Currently, all indicators point towards a bearish signal. With the 21 day MA crossing the 7 day MA, and the RSI heads south. The $85.70 price level is more likely to be breached. New targets should be placed at $85.00.

Bitcoin Cash (BCH/USD)
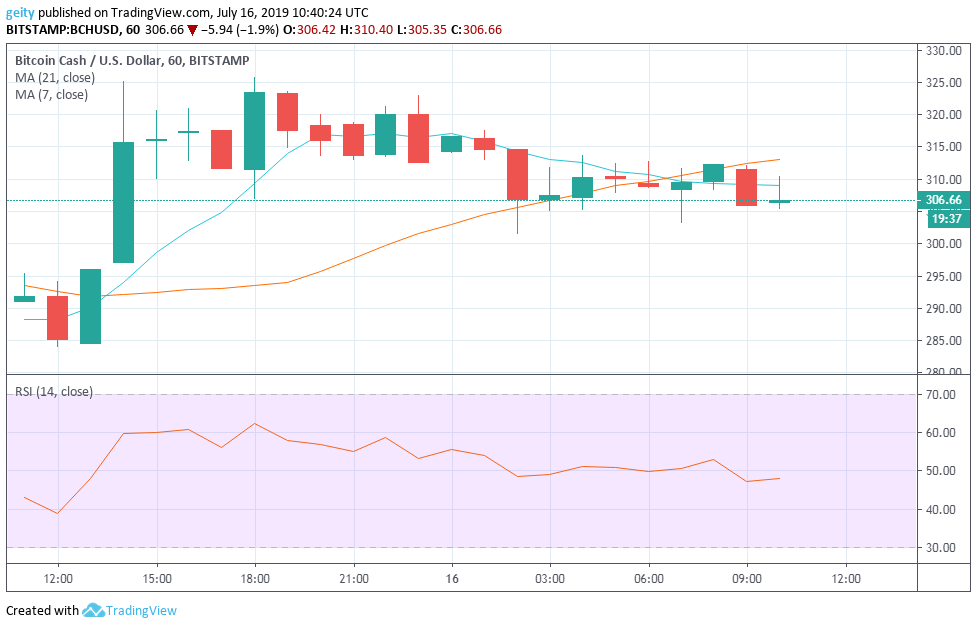
Like LTC, BCH/USD pair has also performed positively. BTC is up by 4.8% having started from $291.80 and is currently at $306.66. This showed an increase in bullish pressure over the last 24hrs. The upward price rally has also been confirmed by the ascending triangle that was formed by the 7-day and the 21-day moving averages.
The market dipped sharply and later on gained momentum. The bulls pushed the price up to a high of $325.12 before embarking to a steady flow. This stood the significance level (support and resistance) at $306.86 and $323.58. Increase in the pair’s price leads to positive investors sentiment.
Presence of a Doji candle is seen at around 15:00 and 16:00 that showed indecision in the market at that period of time. The RSI indicator is currently heading north that shows the unwillingness of investors to go short anticipating for better prices.
Forecast
The 21-day MA is currently above the 7 day MA that indicates a bearish signal. However, due to the recent announcement of Jeton Lib being released (a Bitcoin library exchange), that is expected to provide users with the ability to use OP-Checkdatasig to create multi-party onchain escrow transactions. The price of BCH is likely to upsurge even further in the coming days.
EOS/USD
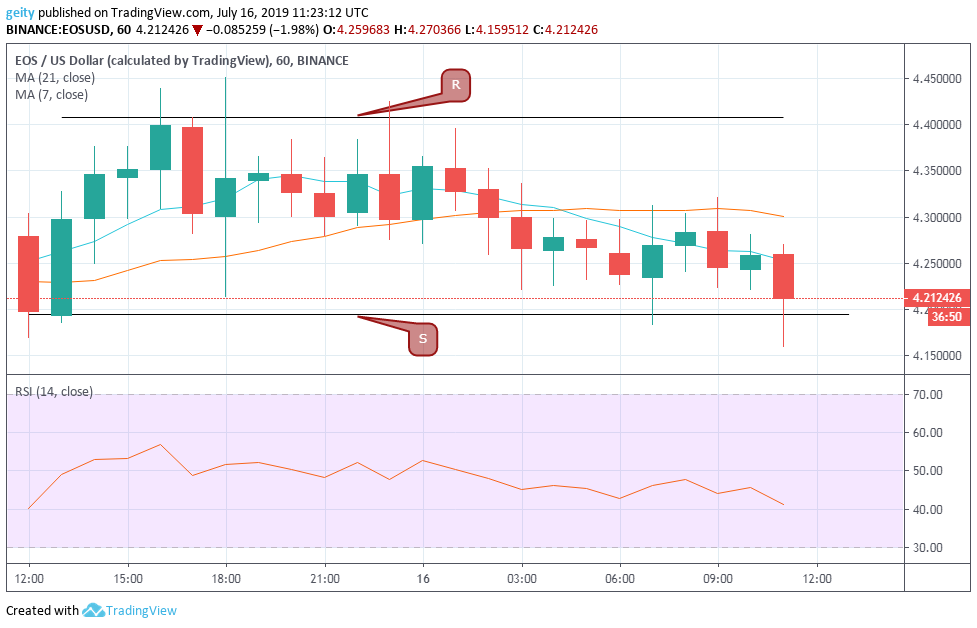
EOS/USD pair has experienced an upward price rally despite a bearish outlook. That has been buttressed by the 21 day MA that is currently above the 7 day MA. EOS/USD pair seemed to have slightly recovered.
EOS is up by $0.33% over the last 24hrs, having moved from $4.19 to $4.21. The pair’s price has been trending in a sideways trend that was confirmed by the horizontal channels. The RSI has declined since it has shifted down from a high of 57.83 to a low of 43.83 that indicated increase sellouts.
The price of top 10 cryptocurrencies is expected to further rise, since the Block.One, the parent company of EOS is working on numerous developments to improve the EOS platform, Such as developing the EOS.IO software.
Forecast
At the moment, all indicators point at a bearish rally. The 21-day MA is seen above the 7 day MA, and the RSI indicator is seen heading south. That signals increase in bearish pressure in the coming few hours.

