

Iota has continued to experience another tough week of declining prices as the market slips a further 17.42% over the past week of trading. Iota is currently trading hands at $0.95 and has experienced a drop of 2.88% over the past 24 hours.
Iota was created in June 2016 and widely became known as the 3rd generation blockchain. Iota uses a distributed ledger technology known as Tangle, unlike most other cryptocurrency projects that use Blockchain as their distributed ledger technology.
The Tangle system can boast many advantages over the transitional Blockchain system due to Tangle’s scalability. Iota is said to have a lower transaction time, lower transaction fees, higher transactions per second and a higher level of security than traditional blockchains. This makes Iota an very exciting project to keep an eye on.
One of the main paths for Iota to reach global adoption is through the Internet of Things (IoT). The IoT are any devices that are linked to the internet through a WiFi chip or similar means. IOTA is intending to become the basis means of communications for the IoT by providing a standard for these devices to conduct commerce over, creating the machine economy that allows devices to transact value to one another completely autonomously.
Iota is currently ranked 10th in terms of overall market cap, with a total market cap value of $2.65 billion. Iota has a lot of losses to regain considering that the market has lost a total of 33.99% over the past 30 trading days alone.
Let us continue to analyse Iota’s price action over the long run.
Price Analysis
IOTA/USD – LONG TERM – DAILY CHART
https://www.tradingview.com/x/4LXnBlht/
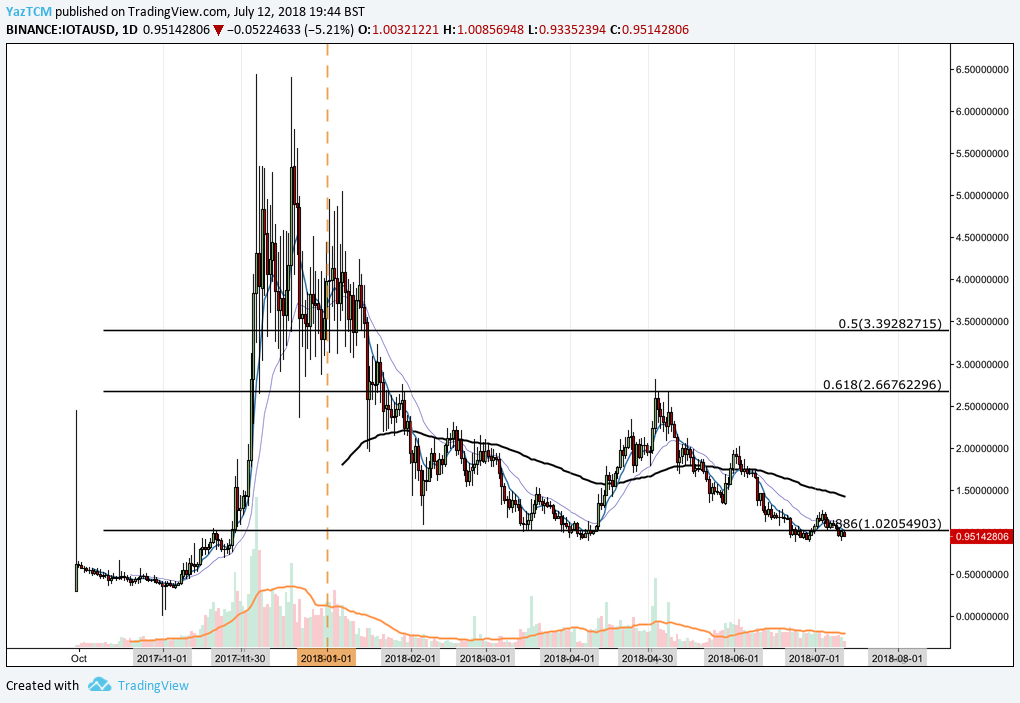
Analysing the chart from the benefit of a long term perspective we can see that the market had experienced a significant bullish run during the months of November and December 2017, when it rose from a low of $0.32 to an all time high of $6.43. This was a price increase of over 1500% from low to high.
After placing this all time high, understandably, the market tanked during the first 3 months of 2018 until it reached support at the .886 Fibonacci Retracement priced at $1.02, in April. This is a Fibonacci Retracement taken from the entire bullish run described above.
Price action is currently once again trading just below the .886 Fibonacci Retracement as it exchanges hands below $1 at $0.95. The .886 Fibonacci Retracement is acting as resistance in this moment in time. If the bulls can push the market above the .886 Fibonacci Retracement then resistance from a long term perspective comes in at the .618 Fibonacci Retracement priced at $2.66.
Let us analyse price action over the more recent term a little closer to highlight some more support and resistance areas.
MAID/USD – SHORT TERM – DAILY CHART
https://www.tradingview.com/x/QIrWXNZz/
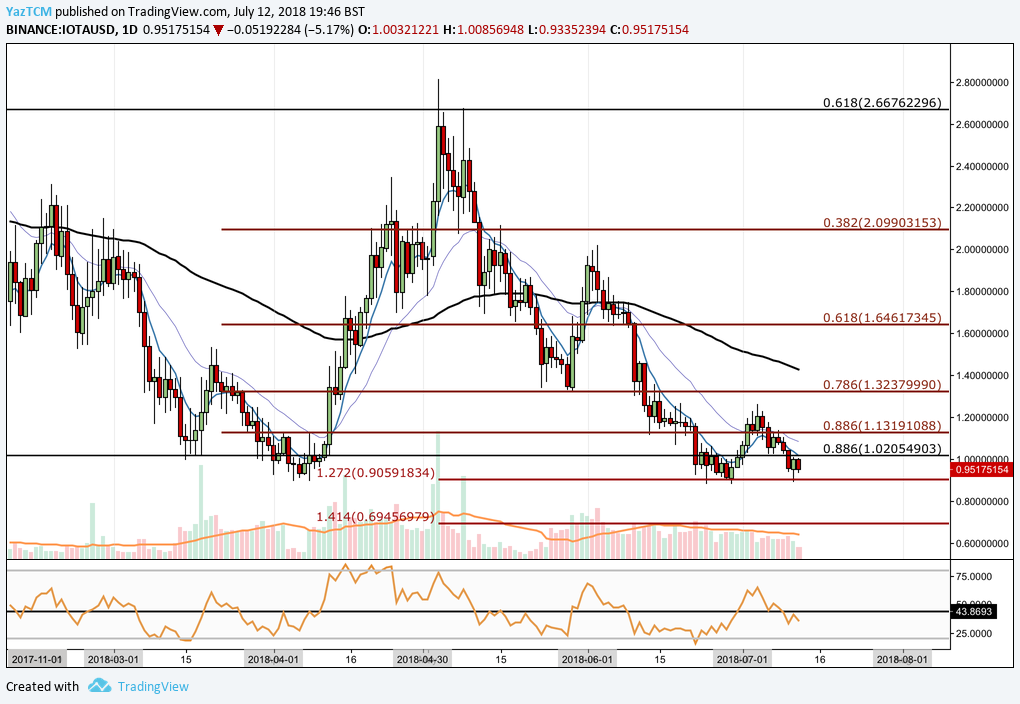
Analysing the chart from a shorter perspective, we can see that the market had experienced a smaller bullish run during April rising from a low of $0.89 extending to a high of $2.81 experienced on the 3rd of May. This was a price increase of 215% from low to high.
We can see that after placing this high, price action has depreciated originally finding support at the short term .786 Fibonacci Retracement priced at $1.32 during May. This is a Fibonacci Retracement taken from the bullish run outlined above.
Price action continued to fall throughout June, falling to the original levels experienced before the bull run in April. We can see that price action had found support at a downside 1.272 Fibonacci Extension priced at $0.90 toward the end of June. This is a Fibonacci Extension taken from the initial bearish swing leg seen after the bullish rally in April.
If the bearish momentum continues within the market then near term support can be located at the 1.272 Fibonacci Extension priced at $0.90. Further support can be located at the 1.414 Fibonacci Extension priced at $0.69, although price action would need significant bearish momentum to head this low.
Alternatively, if the bulls can push the market above the long term .886 Fibonacci Retracement priced at $1.02, near term resistance comes in at the .786 Fibonacci Retracement priced at $1.32. If the bullish momentum continues further, resistance will come in at June’s price high at around $2.


