

Bitcoin and the whole market suffered a massive crash 4 days ago, however, this is certainly not the first time Bitcoin experienced a crash of this magnitude. Throughout history, Bitcoin has seen way worse, losing 93% in value once.
The toughest crash in Bitcoin’s history was the 2011 crash due to Mt.Gox hack, the biggest cryptocurrency exchange at the time. The crash lasted around 94 days going from $29 to $2 and the new all-time high was achieved 461 days later.
A more recent crash was the December 2013 crash where Bitcoin just experienced a massive bull run trading at a high of $1,147 before crashing all the way down to $177, this was a much longer crash as it lasted around 411 days and it took Bitcoin 771 days to see a new all-time high. The new all-time high was $19,891 after the massive bitcoin bull run of late-2017.
This really puts in perspective on the current ‘crash’ as we might not even be able to call it a crash with only a 19% loss in value, something minuscule compared to the 93% crash.
The recent 2018 crash where Bitcoin lost around 82% of its value over a span of almost 1 year formed a very similar triangle pattern that broke bearish followed by sideways trading and then a huge bull run of around 337% increase in value.

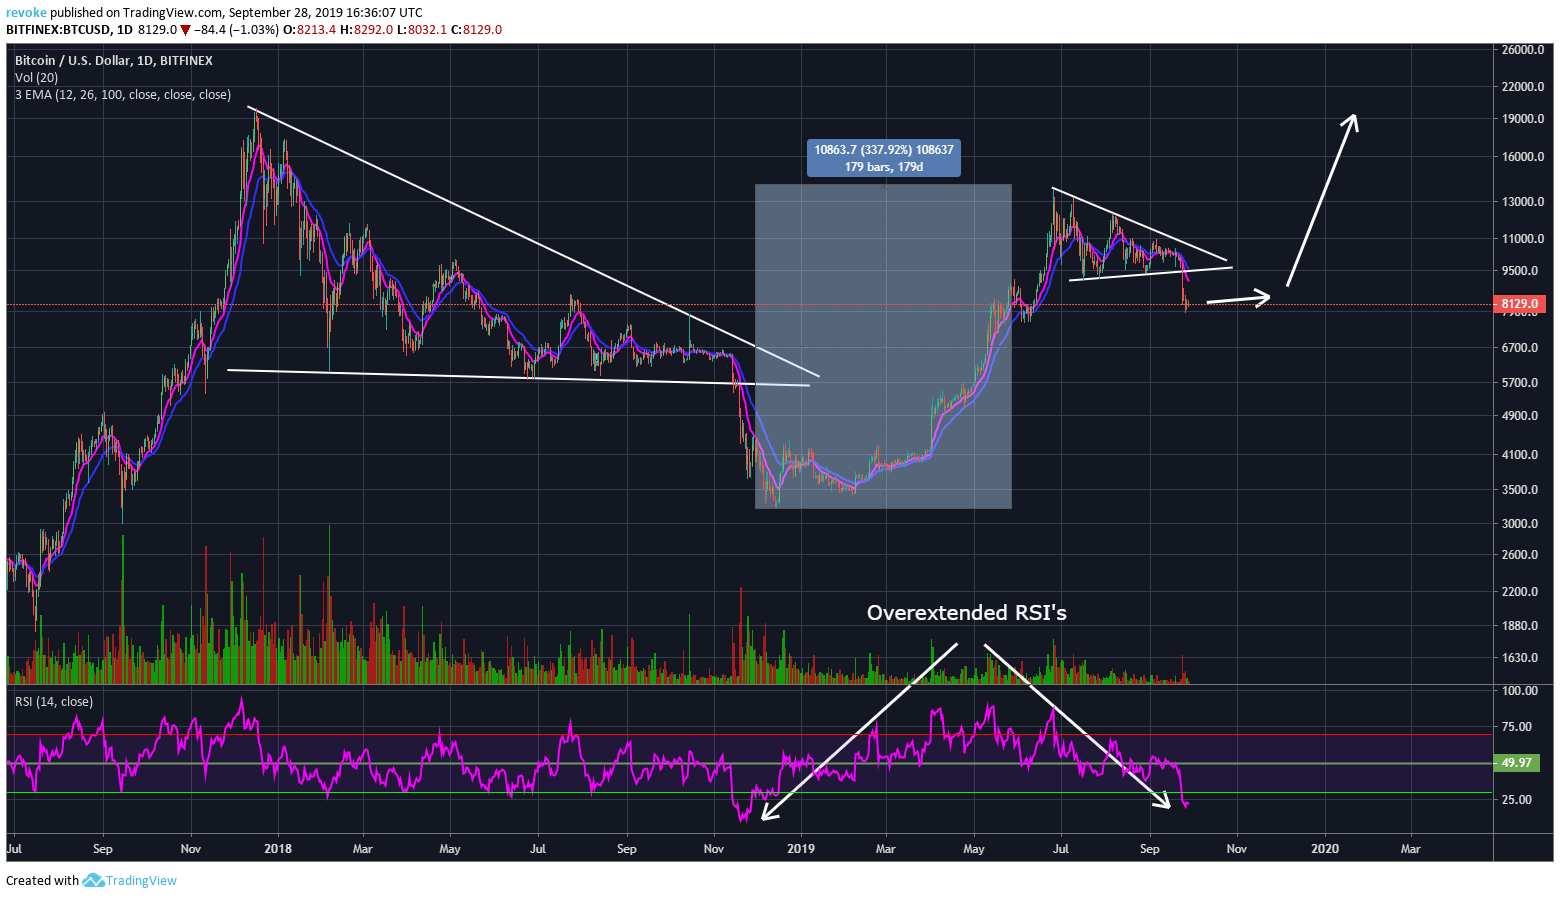
The current triangle pattern seems to be much shorter as BTC traded in between the triangle for 3 months and if history repeats, it would mean the period of sideways trading is also going to be much shorter than previously. If everything goes as planned, Bitcoin could trade sideways for 1 month or less before taking off again in a big way.
Another interesting fact is the RSI which has only been this overextended during the bearish break-out of the triangle pattern in 2018.


