

Supply levels: $140, $166, $190
Demand levels: $126, $106, $88
ETH/USD Medium-term Trend: Bearish
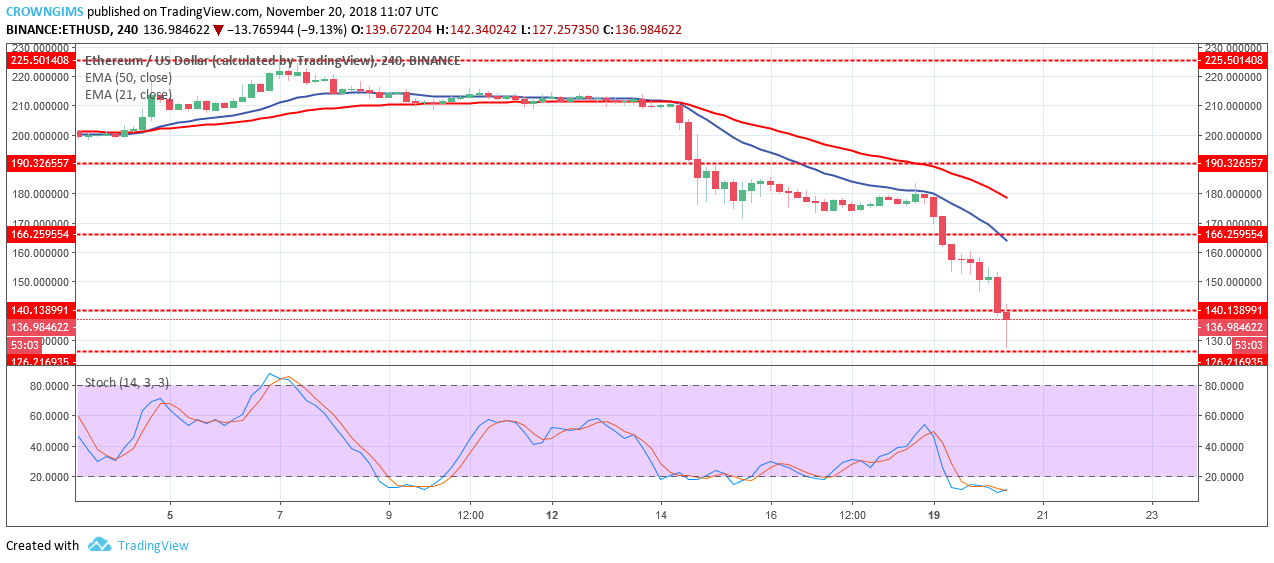
On the 4-Hour chart, ETH is on the bearish trend. Ethereum broke out of the consolidation phase yesterday as the Bulls lost the pressure to push up the price and the bears gained momentum and pull the price down to the low level reached on July 15, 2017. ETH price broke the last week demand levels but now resistance levels of $166 and $140. ETH is trading towards the demand level of $132.
Presently, Ethereum is trading below the 21-day EMA and 50-day EMA in which the two EMAs are fanned apart from each other which indicate that the bearish pressure is strong. Nevertheless, the Stochastic Oscillator period 14 is below 20 levels (that is oversold level) with its signal lines about pointing upside which connotes buy signal and the bulls may soon take over the market.

In case the demand level of $126 holds, the coin will rally to the north and may have a resistance level of $166 as its target. ETH will have its low at the demand level of $106 should the demand level of $126 is broken.
ETH/USD Short-term Trend: Bearish
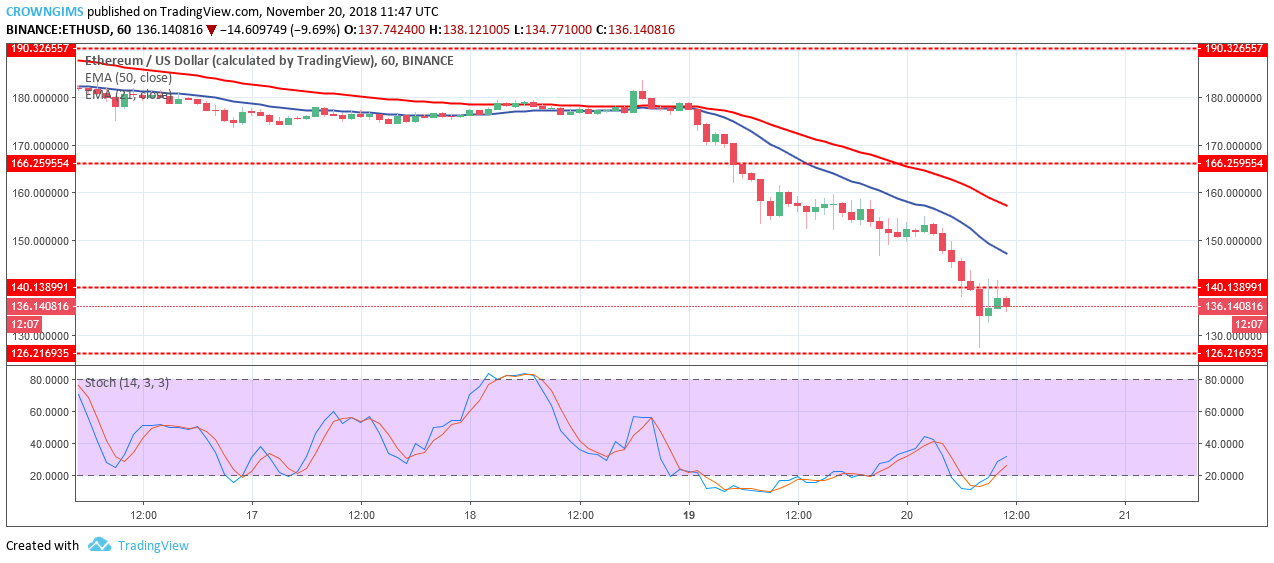
ETH/USD is bearish on the 1-Hour chart. The bears took control of the market as soon it broke out the ranging boundary. ETH price is under the pressure of the bears that pushed the price to the low of $126 demand level.
ETH Price is below 21-day EMA and the 50-day EMA which indicates a downtrend. However, the Stochastic Oscillator period 14 is above 20 levels with its signal lines pointing upward which indicates the buy signal which may be price retracement before downtrend continues.
, and Stellar (XLM) Price Analysis – Recovery Expected Above Major Support Levels")
 and Stellar (XLM) Weekly Price Performance Overview")
