

Supply levels: $184, $189, $195
Demand levels: $179, $175, $168
ETH/USD Medium-term Trend: Bearish
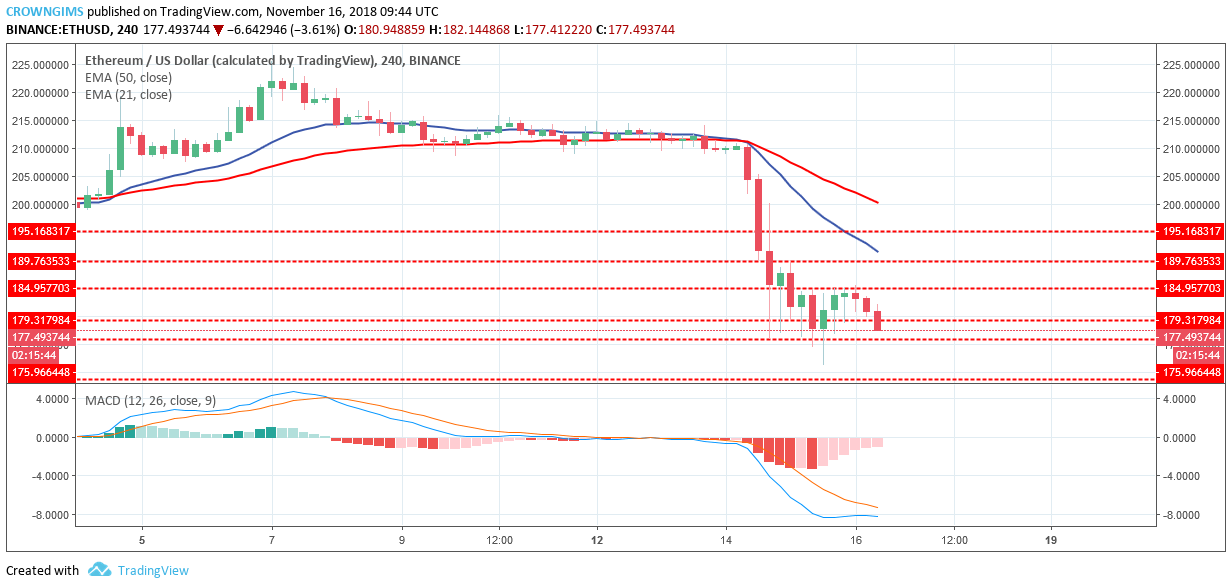
ETH/USD continues in a bearish trend in its medium-term outlook. The breakout of the coin from the consolidation phase was assigned to the bears’ pressure with the formation of a massive bearish candle that led to the failing of ETH price.
Yesterday, increased bears’ pressure led to the broken of $184 former demand level with the bearish engulfing candle that further dropped the ETH price to $168 demand area. The bulls pushed the price to the supply level of $184 late yesterday.

The bears’ pressure remains strong in the medium-term hence the current bearish candle is developing and breaking the demand level of $179 moving toward demand level of $175.
The ETH price is below the two EMAs crossover and the EMAs area fanned apart which suggest stronger strength in the downtrend. The MACD with its histogram is below zero level and its signal lines point down, an indication of downward price movement due to the Bears’ pressure.
ETH/USD Short-term Trend: Bearish
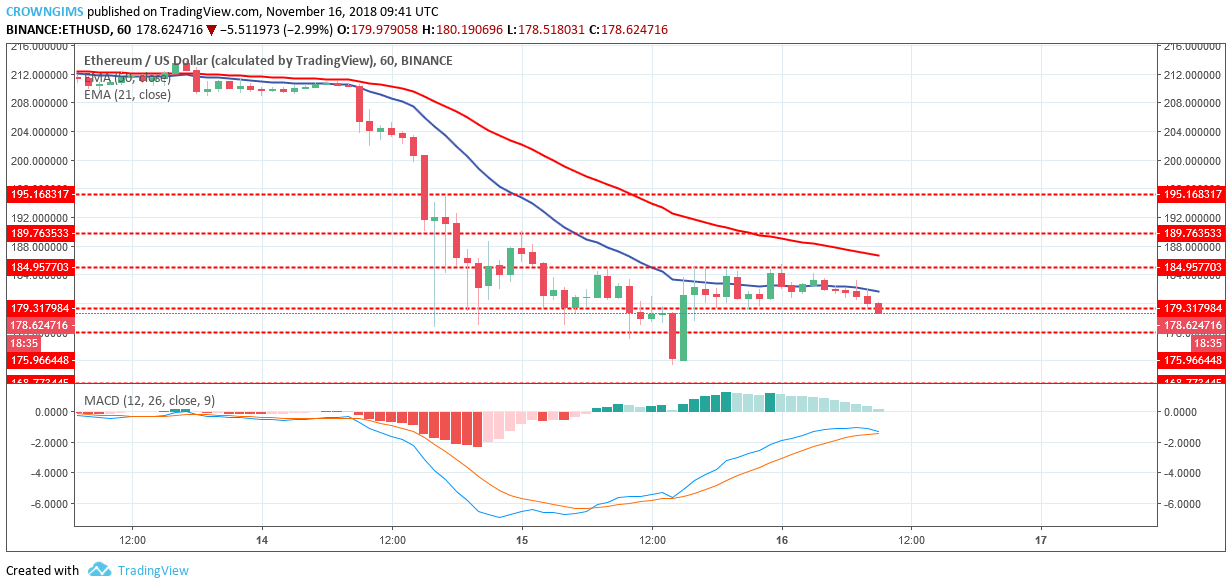
ETH is in a bearish trend in its short-term outlook. The bears were equally in control of ETH market on the 1-Hour chart as evident with the strong bearish candles dropping the ETH price to $168. Yesterday, the bulls returned the price to $184 price level, clearly seen as the bullish engulfing candle formed.
The ETH price is below the dynamic resistance level of 21-day EMA and 50-day EMA breaking the demand level of $179 exposing the demand level of $175. If the bulls defend the demand level of $175 the price will gain the power to move up and break the supply level of $179 and $184 upside, there may be a change in the trend. In case the demand level of $175 does not hold the bears will break this level, downtrend continues.
, and Stellar (XLM) Price Analysis – Recovery Expected Above Major Support Levels")
 and Stellar (XLM) Weekly Price Performance Overview")
