Supply zones: $202, $205, $207
Demand zones: $194, $192, $189
ETH/USD Medium-term Trend: Bearish

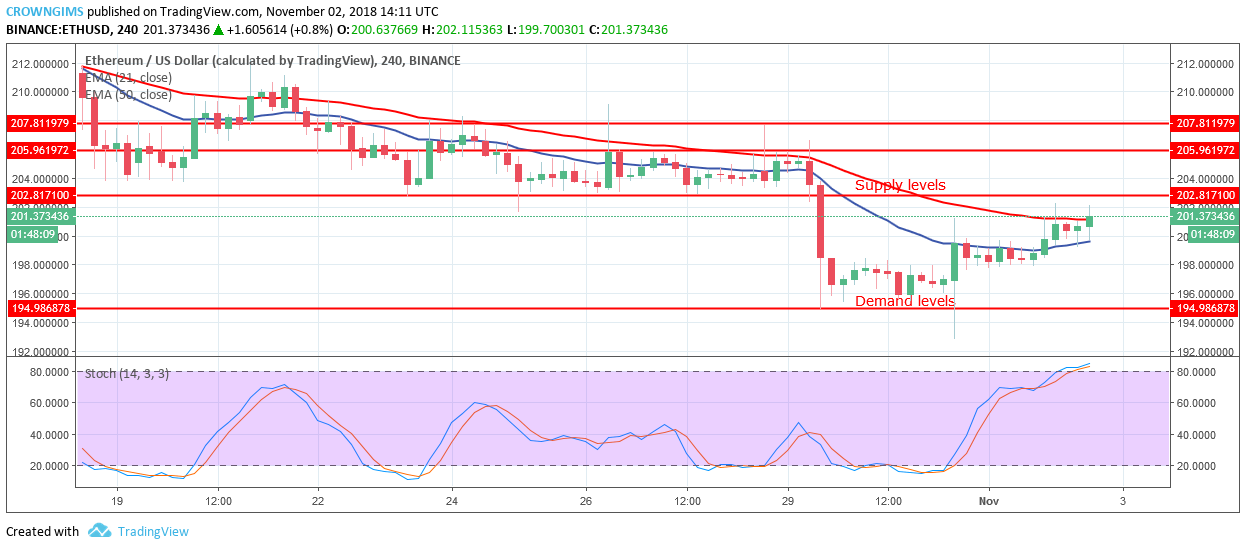
ETH is in its bearish trend on medium-term outlook. On October 31 the bears pushed the ADA price to the demand zone of $194 increased their momentum and broke the zone downside but the bulls rejected further decrease in price and a bullish engulfing candle was formed then it started consolidating till early trading hour today.
Presently, the bulls are moving into the market and pushing ADA price towards supply zone of $202. If the bulls increase their pressure and break the supply zone of $202, then it may find its high in the supply zone of $205.
ETH is of more bullish candles between the 21-day EMA and 50-day EMA with the two EMAs bending towards each other, which indicates the bulls are mounting pressure to take over the market. Nevertheless, the Stochastic Oscillator period 14 is above 80 levels, with the signal lines pointing to the north which indicates a buy signal.
ETH/USD Short-term Trend: Bearish
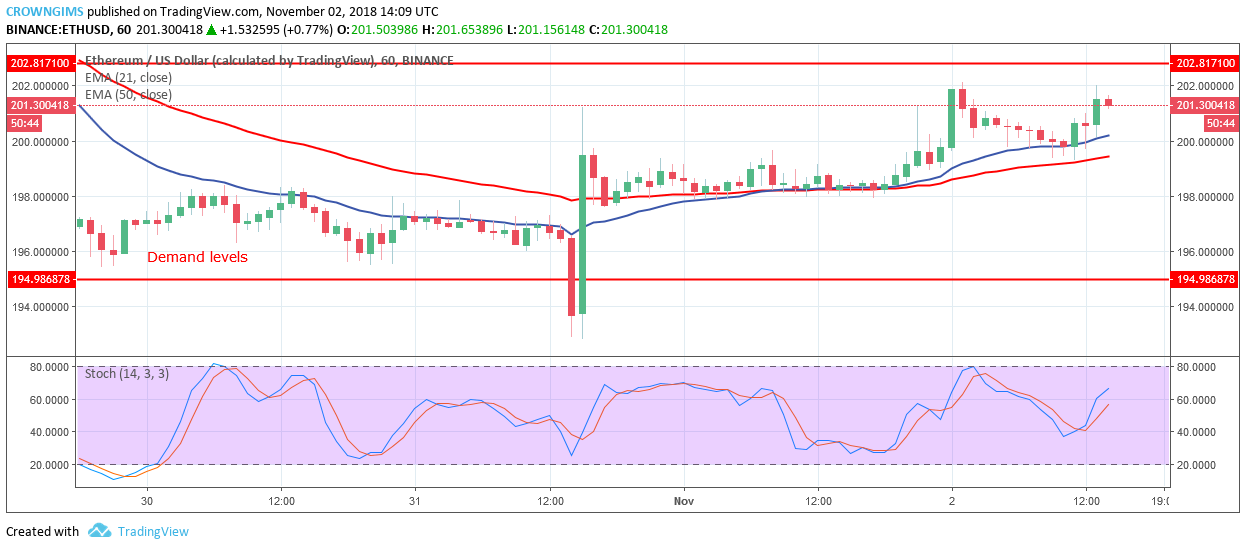
 ETH/USD is bearish in its short-term outlook. ETH has been bearish till October 31, when the bulls made the ETH price to rally to the north with the formation of bullish engulfing candle that broke through the dynamic resistance and supply 0f 21-day EMA and 50-day EMA. The bullish movement was stopped by the Bears’ momentum. Then it started consolidation.
The bulls are gradually pushing the ETH price toward the supply zone of $202. With more pressure from the bulls, supply zone of $202 may not hold, break out to the upside of the zone and the ETH price will be exposed to $205 supply zone.
The two EMAs are gradually separating from each other meaning that consolidation is over. ETH is above 21-day EMA and 50-day EMA which indicate upward movement. Nevertheless, The Stochastic Oscillator period 14 is above 50 levels with its line pointing towards north which is buy signal.


