
 Technical Analysis #001 - Decred Approaching long term .886 Fibonacci Retracement support level")
Decred has suffered a 24 hour price drop totalling 1.77% over the past trading day. The cryptocurrency is currently trading at $44.48 and has suffered a 17.53% price drop over the past 7 trading days. It still important to highlight that this bearish decline has been experienced across the entire cryptocurrency industry.
Decred was created in February 2016 and was intended to become an open and progressive cryptocurrency with the ability for the community to govern the network through mechanisms built on the blockchain. It priorities decentralised governance by moving all the network decision making upon the blockchain. This means that all token holders will have the right to vote in tany proposed upgrades to the network.
Decred uses a hybrid mechanism to achieve consensus by utilising both proof-of-work and proof-of-stake algorithms. This ensures that profits generated through the Decred network cannot be dominated by one single group allowing distribution to be fairer.
Decred is currently ranked at 27th position in terms of overall market cap across the entire industry with a total market cap value of $367 million. The cryptocurrency has significant losses to regain after tumbling by up to 50% over the past 90 trading days.
Let us continue to analyse price action for Decred over the long run.
Price Analysis
DCR/USD – LONG TERM – DAILY CHART
https://www.tradingview.com/x/NssdmQJq/
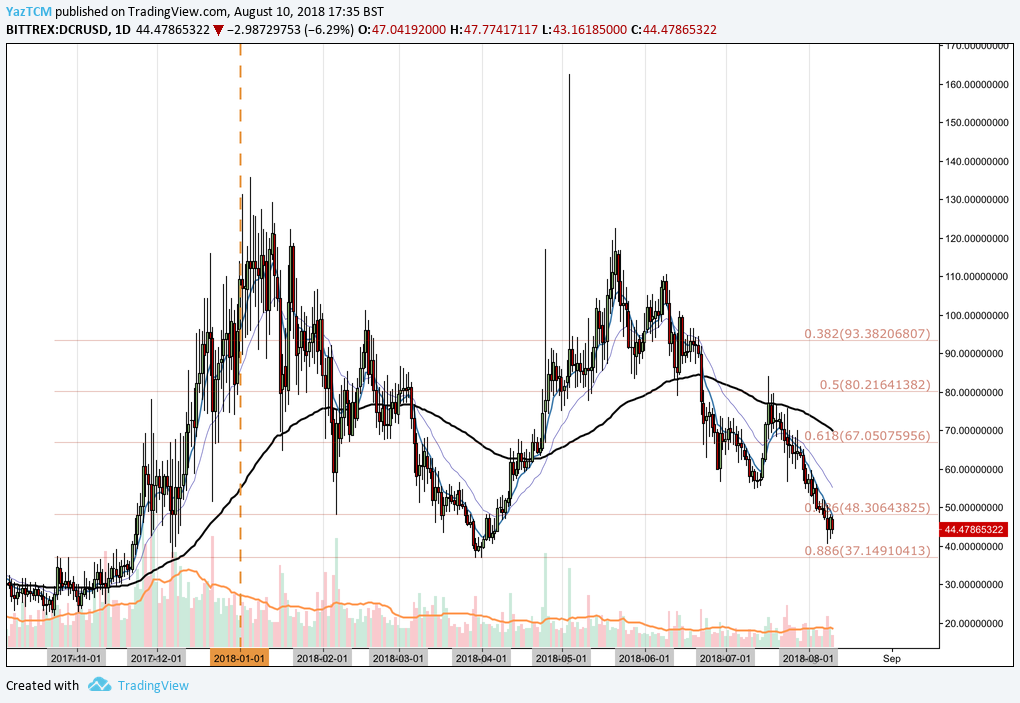
Analysing the market from the long term perspective presented above, we can see that Decred had experienced a significant bullish trend toward the end of 2017 when price action started at a low of $22.79 on November 2nd 2017 and extended to a high of $135.67 on January 5th. This was a price increase totalling 475% from low to high.
We can see that after placing this high the market proceeded to depreciate, initially finding support at the .5 Fibonacci Retracement level priced at $80.21 in January 2018. This is a Fibonacci Retracement measured from the entire bullish run outlined above.
Price action continued to fall through February until finding support at the .886 Fibonacci Retracement priced at $37.14 in March. This proved to be a strong resistance zone as price action reversed at this point and went onto create another bullish run.
Let us continue to analyse this second bullish run a little closer and highlight any potential future support and resistance zones.
DCR/USD – SHORT TERM – DAILY CHART
https://www.tradingview.com/x/ROfQ2Dad/
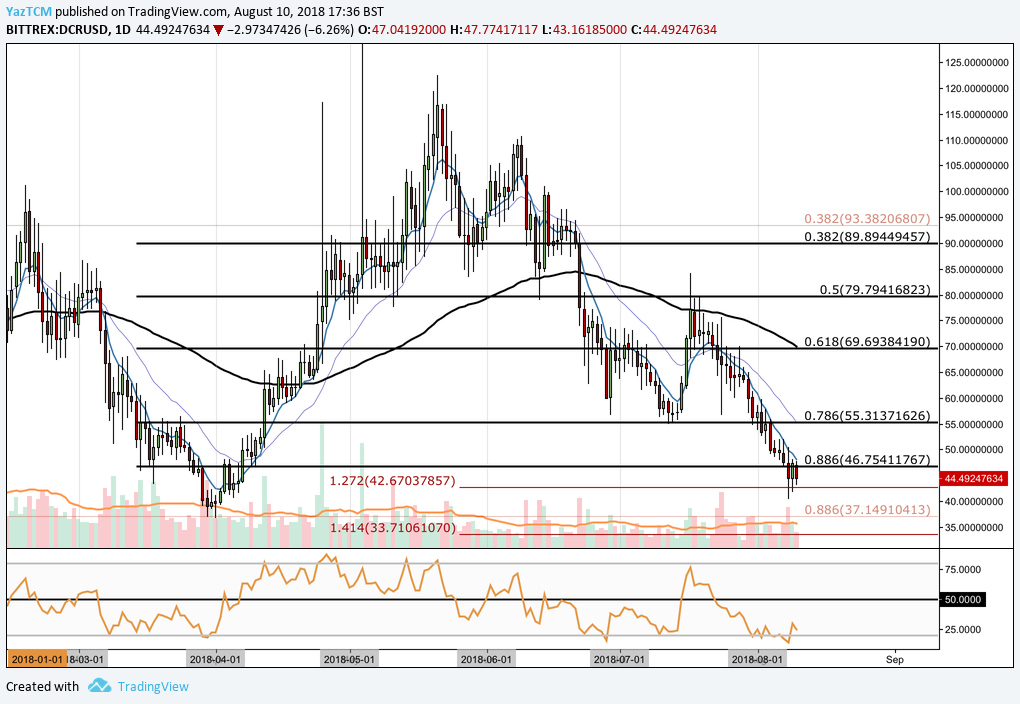
Analysing the market from a short term perspective, we can see that Decreds second bullish run initiated from a low of $36.81 on April 15th 2018 and extended to a high of $122.56 on May 21st 2018. This was a price increase totalling 220% from low to high.
It is important to highlight a significant price spike witnessed on May 4th as markets surged to a high of $162, briefly. This occurred due to UpBit exchange announcing that they would be adding the DCR/KRW pair to their exchange.
Price action had found support at a short term .5 Fibonacci Retracement priced at $79.79 during June 2018. This is a short term Fibonacci Retracement measured from the bullish run aforementioned.
Price action was not able to sustain itself above these levels and continued to fall further lower during July and August until finding support below the .886 Fibonacci Retracement priced at $46.75. We can see that the market had specifically found support at a downside 1.272 Fibonacci Extension level priced at $42.67, where the market was swiftly rejected.
If the bulls can push price action back above the .886 Fibonacci Retracement, we expect immediate resistance to be located at the .786 Fibonacci Retracement priced at $55.31. Further long term resistance above this level is expected at the .618 Fibonacci Retracement level priced at $69.69. This area of resistance will be bolstered by the 100 day moving average which is also currently hovering at this price area.
Alternatively, if the bears step into the market and push price action below $42.67 we expect immediate support to be located at the long term .886 Fibonacci Retracement level priced at $37.14.
This level has provided ample support throughout the year and is the initial starting position of the rally witnessed during April 2018. If the bears do push price action below this level we expect further support below to be located at the 1.414 Fibonacci Extension level priced at $33.71.
, and Stellar (XLM) Price Analysis – Recovery Expected Above Major Support Levels")
 and Stellar (XLM) Weekly Price Performance Overview")
