

After a week filled with turns and twists, Bitcoin is on the verge of pulling a major move after spending the last 48 or so hours ranging in pretty much the same zone.
As of writing, the cryptocurrency is trading at $38,709 after last week’s bullish candle was completely annihilated. Again, although the price has managed to push back against the downside for the last six weeks by printing sideways, it is still down 44% from November’s high.
That said, traders continue to appreciate the calm presented by the pioneer cryptocurrency despite geopolitical turmoils, providing off-the-cuff Bitcoin predictions based on price patterns that could initiate a bullish storm.
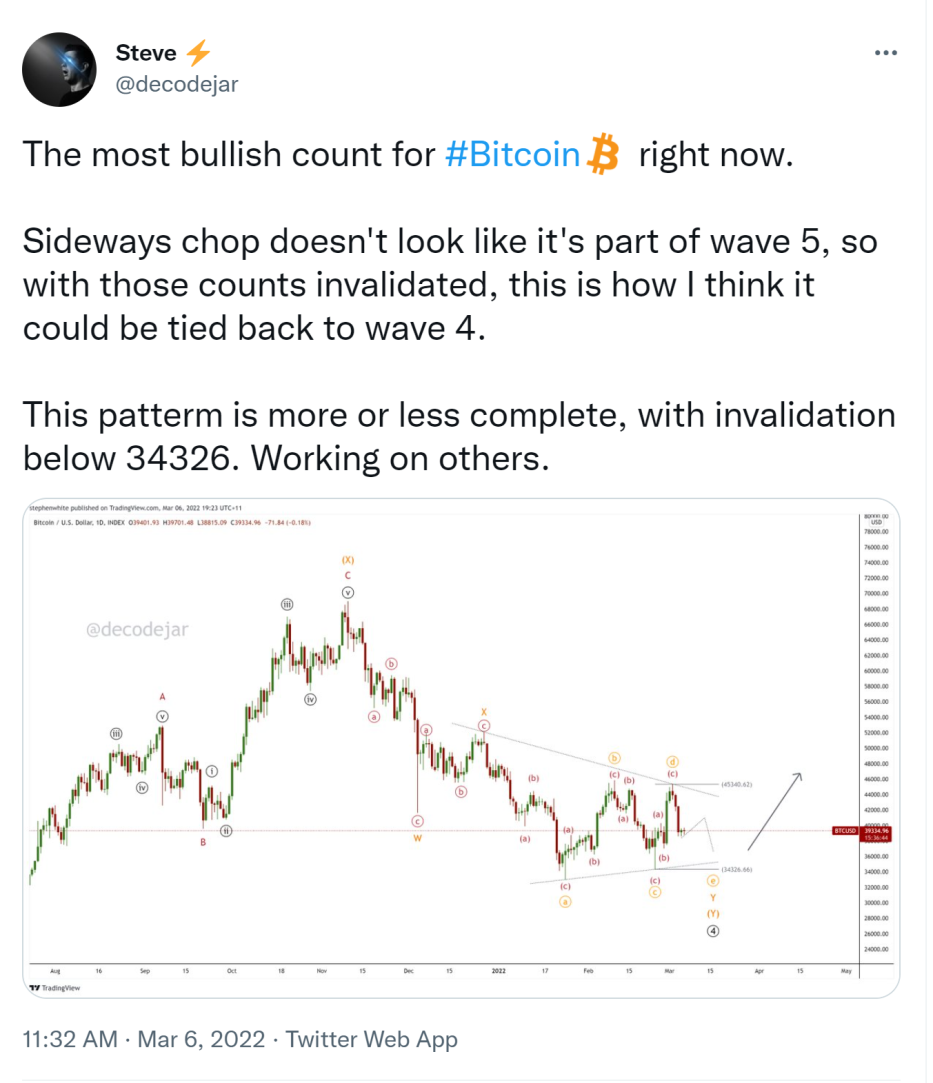
One market pundit ‘DecodeJar’ for instance maps out a “symmetrical triangle”. Albeit being a neutral pattern, he is confident that price could get out of this squeeze pattern to the upside, referring to an Elliot wave that seems to be completing.
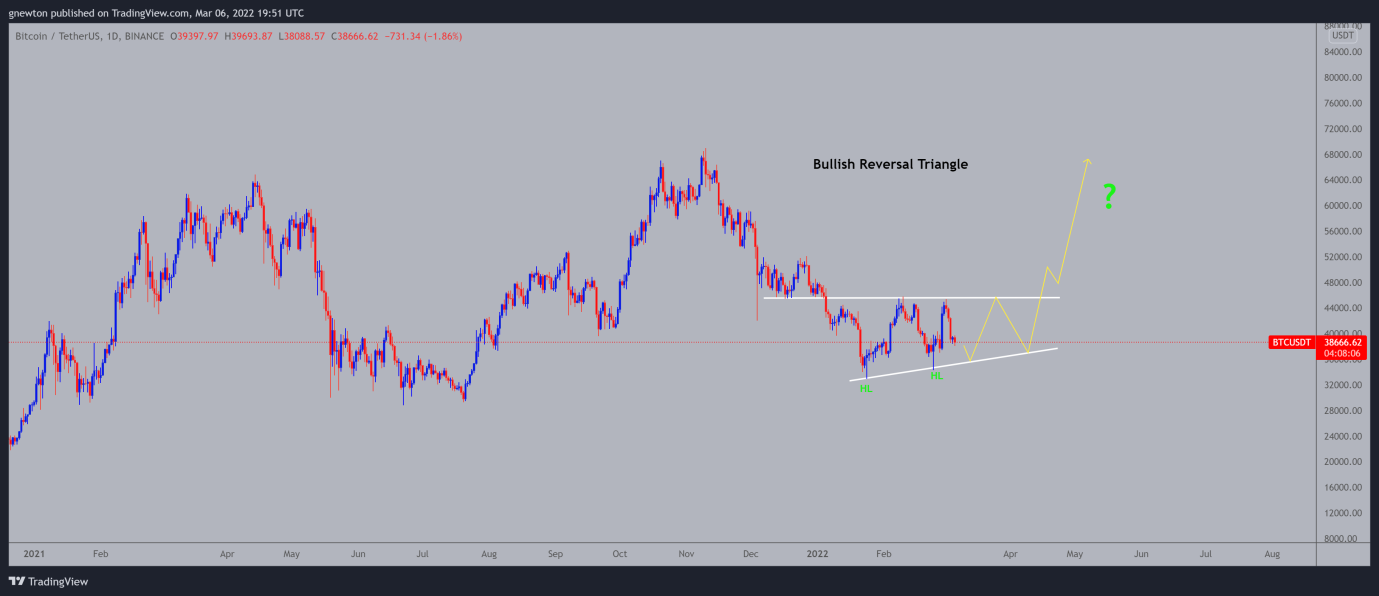
Another way to look at this is the formation of a “Bullish reversal Triangle pattern”. The pattern which historically represents a change of trend is characterized by the formation of Higher Lows (HL), signifying bulls outstripping bears. The resistance is thus expected to be taken out as price attempts to make a new high, setting the pace for a bull run.

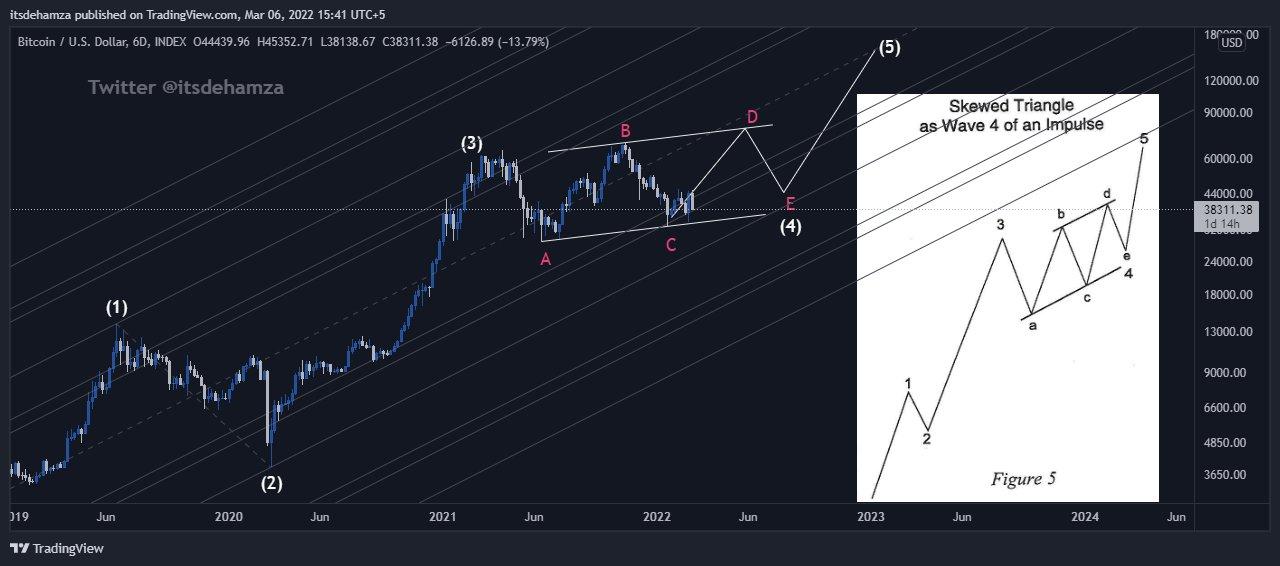
Other analysts like CT’s ‘BTCfuel’ believe that Bitcoin “will only go to about 70-130k in 2022” to pave way for the altcoin season because, as he says, they are in their final bubble stage. The pundit thus pretty much agrees with this chart posted by another trader.
That said, while attempting to predict market movements is certainly a good thing, it’s also important to appreciate that price could go out on either side after breaking out of these patterns.
According to Feras, host of ‘Crypto Feras’, a YouTube channel dedicated to crypto charting, key support or resistance areas become weaker with more price bounces. According to him, “Bounces of the 30-33k zone are getting weaker and weaker, very similar to 2018 PA when Bounces of 6-6.4k kept getting weaker and weaker.” This means that bulls have to print a higher high to invalidate this- otherwise we all know what comes next.


