

Cardano (ADA/USD)
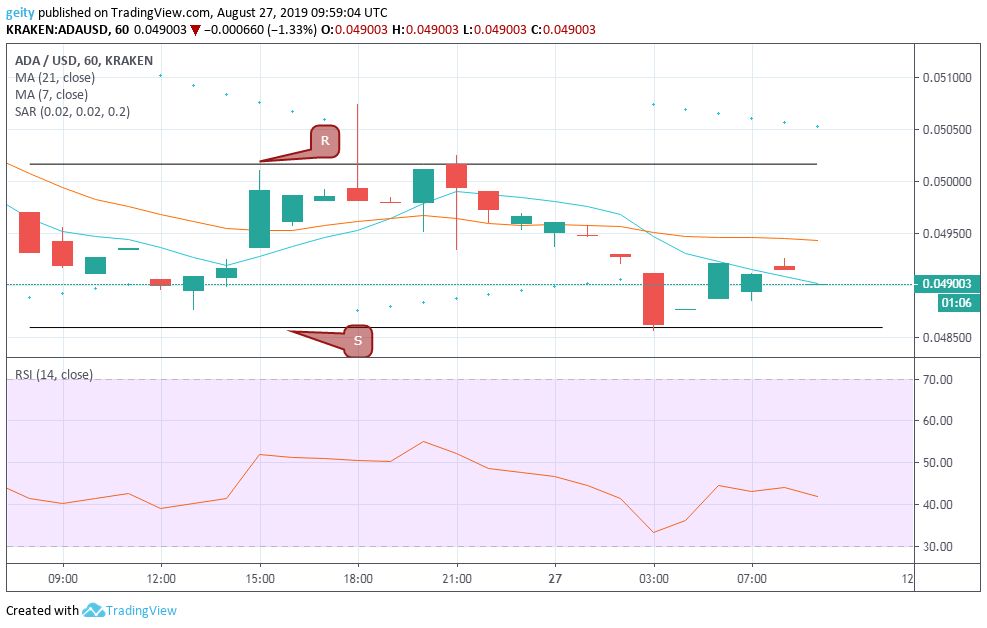
In an hourly chart, the price of ADA/USD pair has been trading on a stable range, and traders have not yet decided on what move to make next. The indecisive market was reflected by the price action that oscillated in horizontal channels between $0.0502 and $0.0489 levels respectively.
Notably, the pair’s price escalated from where it closed trading yesterday at $0.0493 to now changing hands at $0.0490. In the meantime, there is no much hope for investors since the price-performance showcase very strong volatility. The RSI indicator is currently ranging below level 50 that signals an increase in selling pressure, which is a positive sign for the bears.
Forecast
Further downside move should be anticipated since the parabolic SAR is seen above the candle that gives investors a sell signal. The 21 day MA has also cross above the 7 ay MA that also indicates a bearish outlook. If sellers break the $0.04800 level then the new target should be set near $0.04000.
Ripple (XRP/USD)
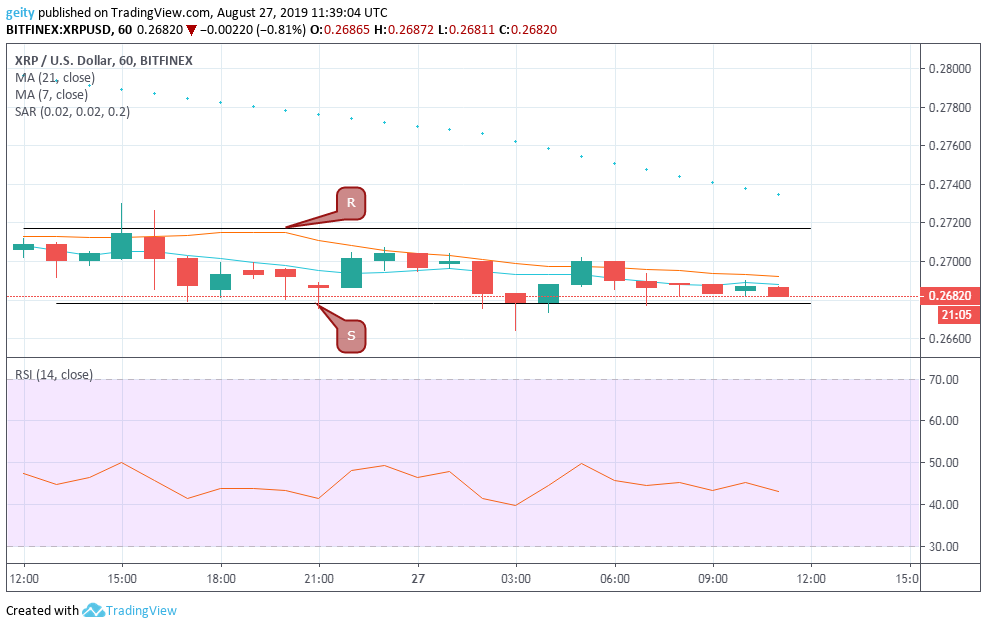
XRP/USD pair is likely to succumb to a downside break with most indicators pointing at a bearish momentum. The 21-day MA has been gravitating above the 7-day MA in the last 24hrs that showed that the bears are in control. The parabolic SAR was also seen above the price action that signals a strong downside trend reversal.

XRP/USD pair is slightly down by 0.99%, having moved from $0.27087 to currently trading at $0.26820. The pair’s price seemed to have struggled to break above the $0.27300 but managed to trade between that critical resistance level $0.27171 and support level at $0.26782. However, a break below $0.2670 is most likely.
Forecast
The RSI indicator is currently hovering below level 50 that signals a strong bearish pressure, a downside break below $0.26780 and 0.2650 levels could result in a further decline to $0.2450.
Stellar (XLM/USD)
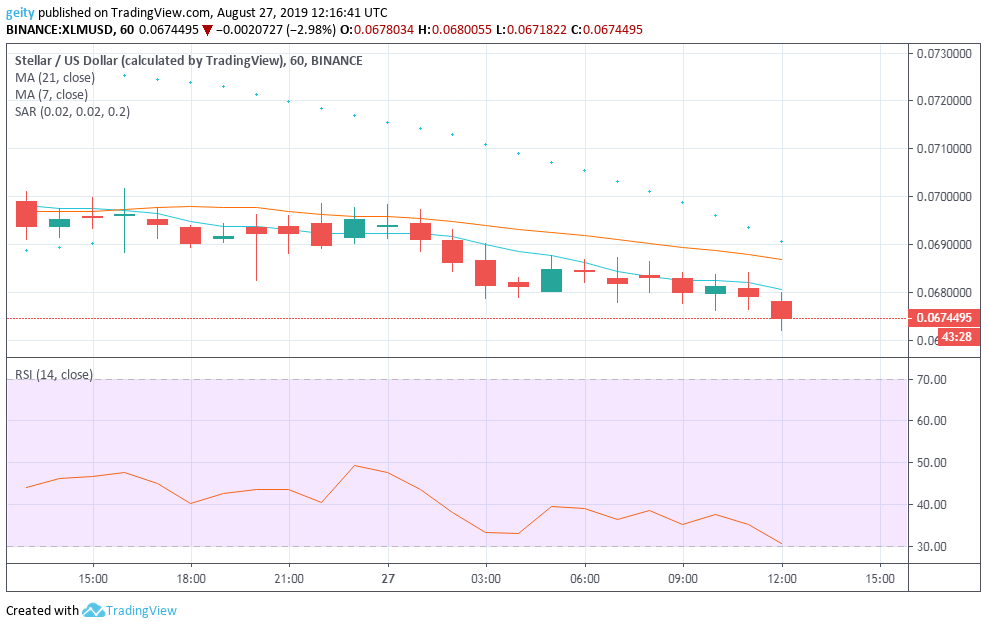
XLM/USD pair is also on a downside move, with few attempts to breach $0.0698 resistance level. Apparently, all the indicators suggest a bearish sign since the 21 day MA is currently dominating above the 7 day MA, which gives support to the bearish momentum.
Notably, the pair’s price escalated from $0.0694 to $0.0674 that translates to a slow dip of 0.3% over the last 24hrs. The appearance of a Doji candle was also seen repeatedly that signaled equality and indecision in the market. The RSI indicator is at the moment heading towards the oversold territory, which gives investors a negative sign.
Forecast
A further bear run should be anticipated since the parabolic SAR that is trading above the candle indicating a sell signal. A break below $0.06500 may lead to a continuous decline in the near term.


