

Bitcoin (BTC/USD)
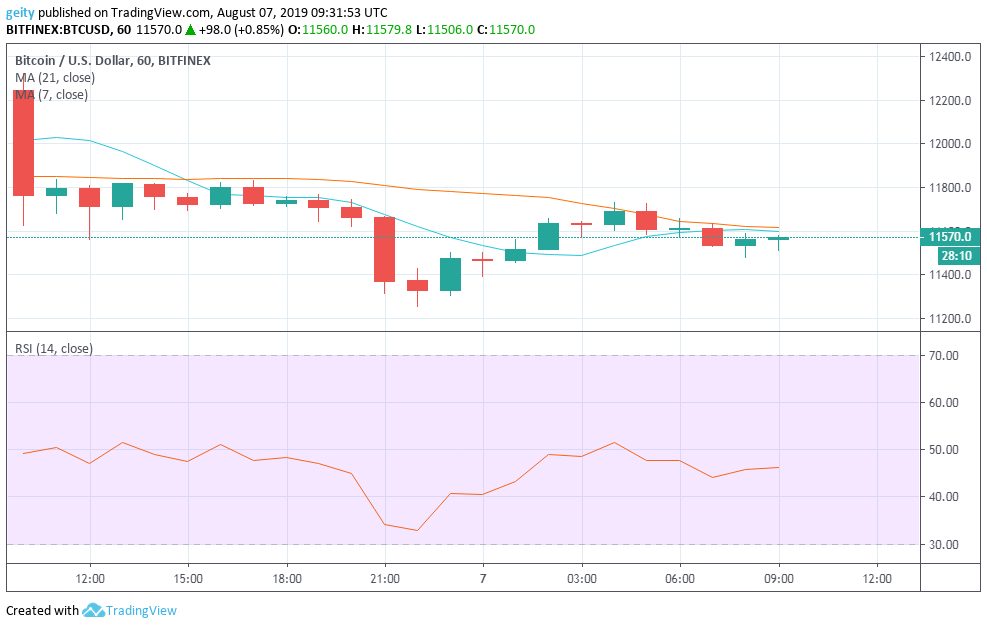
On an intraday chart, BTC/USD pair faced a bearish run after exhibiting price rejection above $12000 level. The downward pressure was however signaled by the 21 day MA that is gravitating above the 7 day MA that signaled to increase in sellouts.
The pair’s price saw a short- term period of consolidation below the support level $11694.6 that later dipped slightly to a low of $11249.0 before it gained momentum to the current price rate at $11570.0. The RSI indicator is at the moment hovering between level 60 and 40 that signals a lack of dominance from either buyers or sellers.
The pair’s price is down by 1.7% with a market capitalization of $207 billion.
Forecast

At the moment, both moving averages are trending east, which shows that the market is likely to encounter a short-term period of consolidation below $11400 and a breakout near $11900.
Ether (ETH/USD)
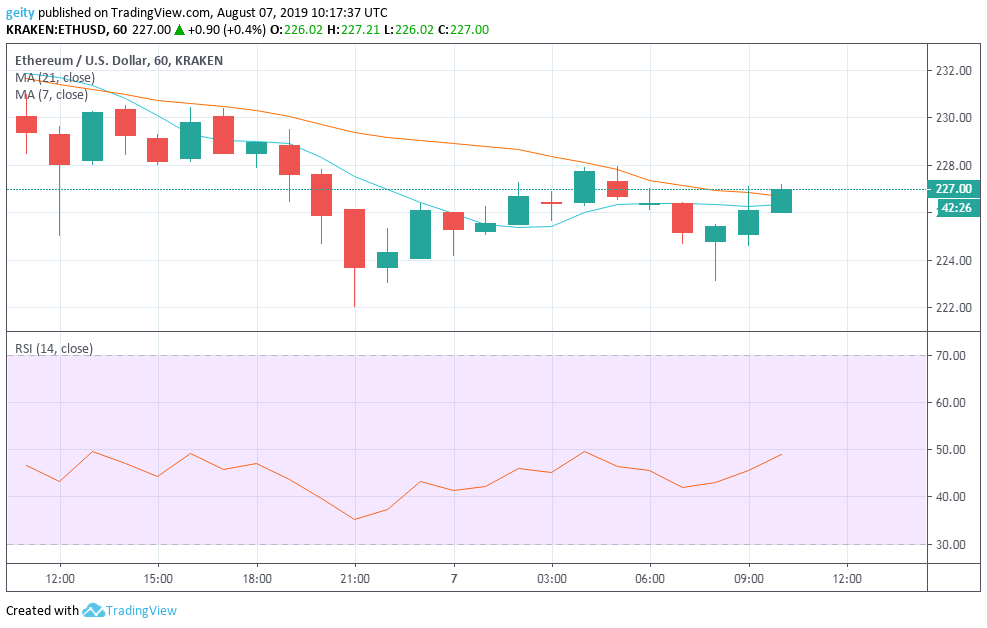
ETH/USD pair has also recorded a bearish outlook with an intraday down surge of 2.4%. ETH began the sell-offs trading at $229.39 and is currently trading at $227.00. The downward move was supported by the 21 day MA that hovered above the 7 day MA over the last 24hrs.
In the market, the dip in ETH price has led to negative investor’s sentiment. However, the RSI indicator is at the moment heading north, which signaled to an increase in buyouts. This showed that the bulls had taken over the market momentum thus a price recovery may be possible near $230.00 level.
Forecast
The 7 day MA is most likely going to cross over the 21 day MA in the next few hours. The RSI indicator is heading north that signals bullish momentum. However if the 7 day MA fails to cross the 21 day MA then a downward move near $210 is most likely to be seen.
Tron (TRX/USD)
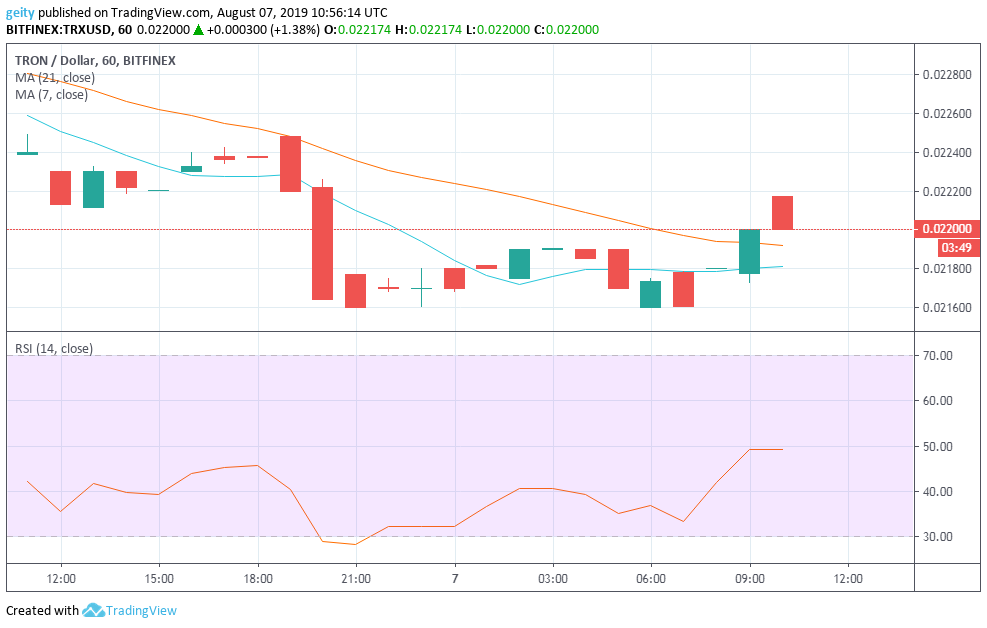
TRX/USD is down by 1.8% and is currently trading at $0.022000 that signaled a bearish run. The downward move has also been buttressed by the 21 day MA that gravitated throughout the intraday above the 7 day MA. At around 19:00, the RSI indicator was seen below level 30 that indicated an oversold market territory. This also signaled a high increase in sellouts.
Presence of a Doji was also seen repeatedly indicating indecision in the market momentum. The RSI indicator also gained momentum at around 07:00, since it moved from a low of 33 to a high of 49 that reflect an increase in buyouts. The slight upward rally shows that investors are not ready to go short since they are waiting for much better price values.
Forecast
The 21 day MA is at the moment gravitating towards the 7 day MA and looks set to cross below it which signals a bullish outlook. New targets should be set at $0.022300.


