
, Cardano (ADA) and Ripple (XRP)")
Summary
Despite a generally bullish outlook for cryptos over the last 24 hours, some coins have taken a slow dip. However, most coins have kept up an upward rally which has positively impacted investors. Support zones have moved up while resistance zones have been tested and breached severally. This supports an upward price rally if the Bulls can maintain that momentum.
TRX/USD
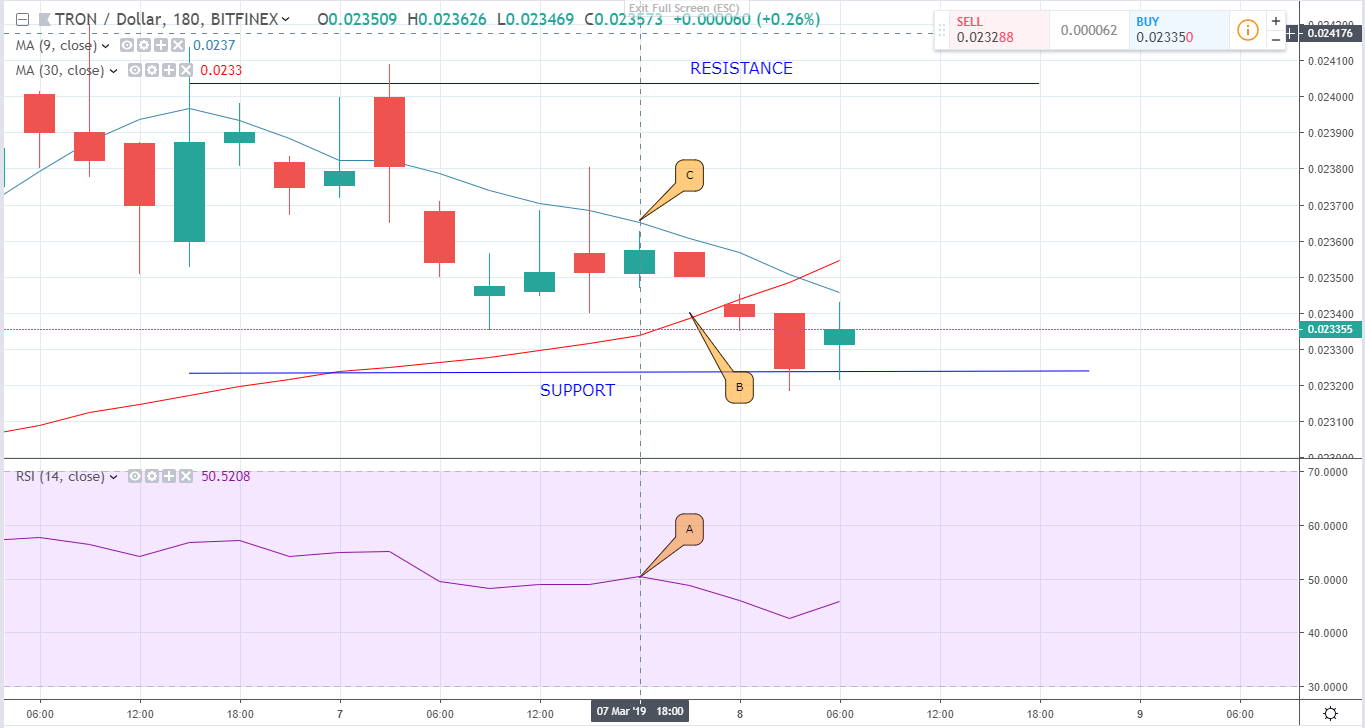
The TRX/USD pair was trading at $0.02375 as at 0000h on March 7 and is now trading at $0.02331. This represents a minimal 0.26% dip in the pair’s price. This drop in price led to increased buyouts by investors as shown in the RSI (A) which dipped slightly. Sales of TRX were to the tune of $119.23 Million over the last 24 hours which brought the coin’s capitalization to $1.5 Billion.
Forecast

On three hour charts, the 30 day EMA (B) has crossed over above the 9 day EMA (C) which signals a bearish run in the coming days.
ADA/USD
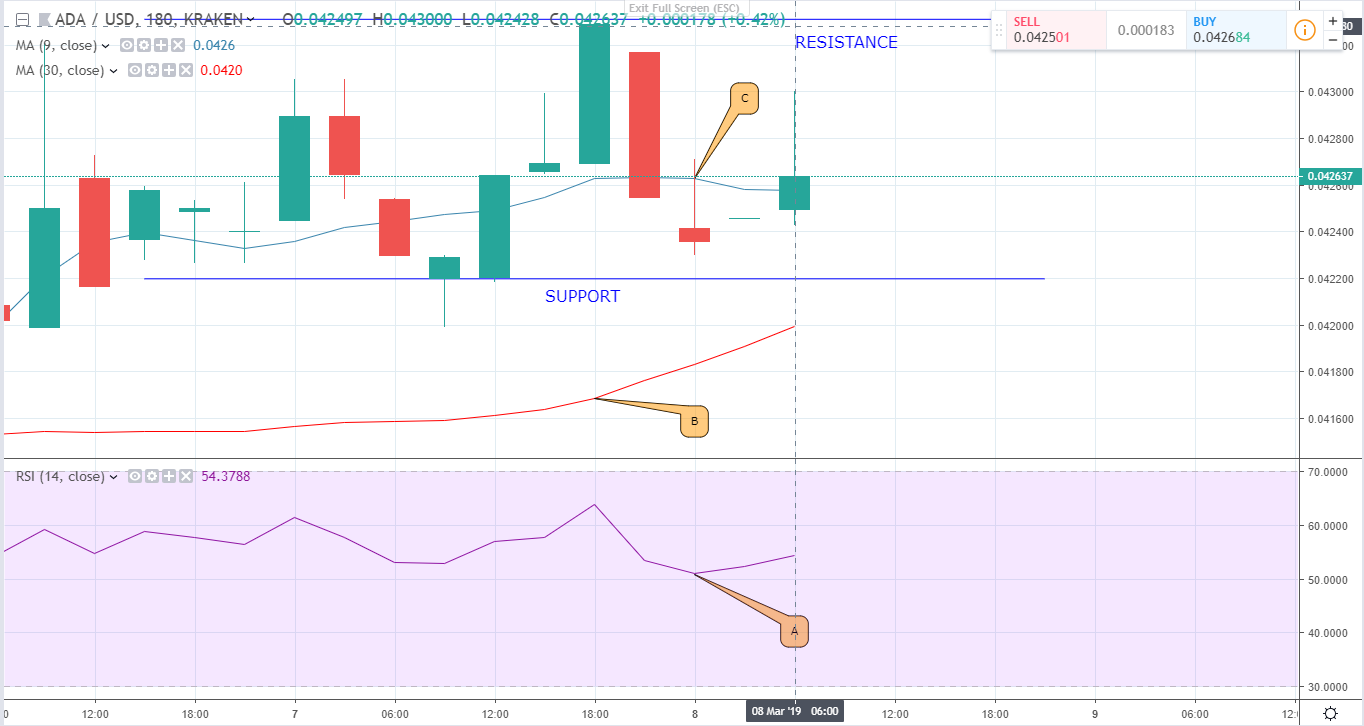
Unlike Tron, Cardano has exhibited a bullish outlook. It is up by 0.66% in the last 24 hours, having begun off March & trading at $0.04245 against the current rate of $0.043589. This upward price rally has also been buttressed by both moving averages (B and C) which are moving upwards.
In the markets, the increase in Cardano’s price positively impacted on Investors. The RSI (A) is headed north which shows a reluctance by investors to sell off their ADA holdings in anticipation for better prices.
XRP/USD
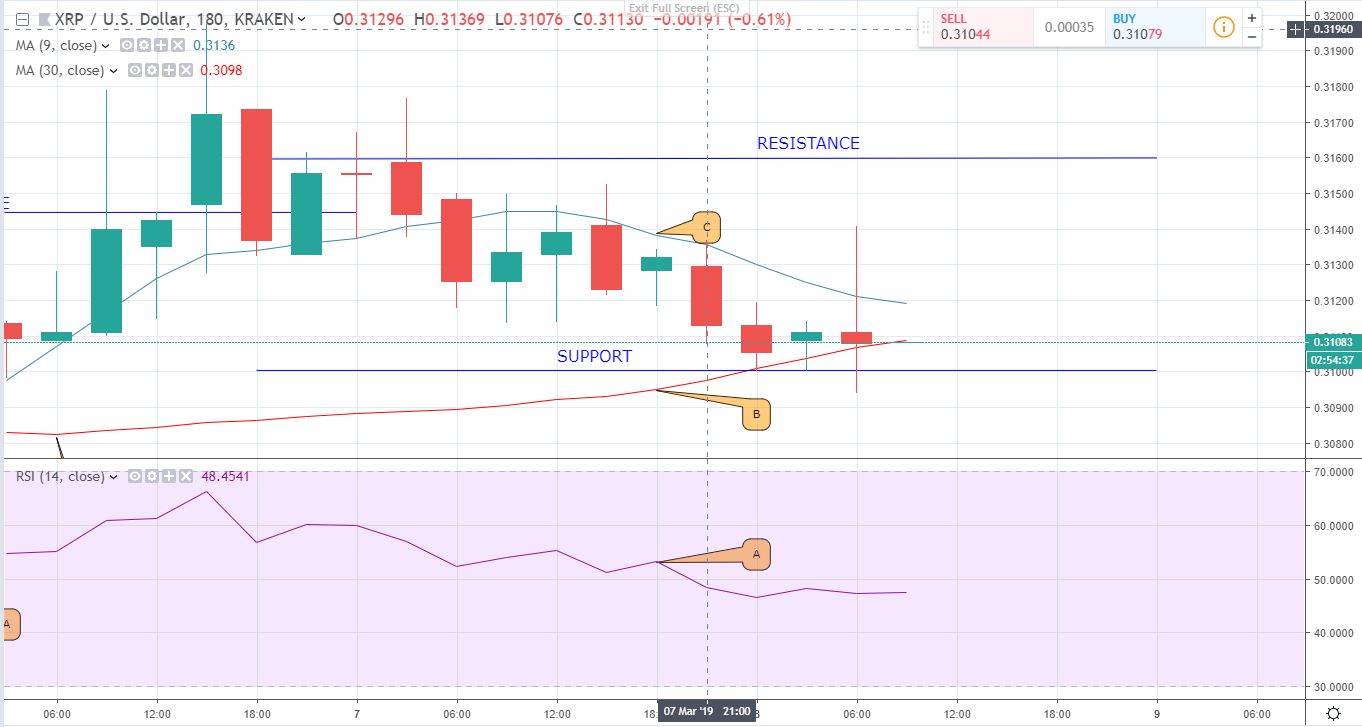
XRP has undergone a bearish price movement, moving from $0.31557 to $0.31083. This translates to a 1.91% drop in the pair’s price. The direct effect of this drop was an increase in XRP sale offs. The RSI (A) dropped from 67 to the current 48. This increase in sales shows reduced confidence in the coin.
Forecast
At the moment, the 30 day EMA (B) is gravitating towards the 9 day EMA (C) and looks set to cross above it in a contracting triangular pattern. Also, the 30 day EMA is acting like the price support. All of these indicators signal a bearish outlook.


