

Cardano has continued its recent bearish decline, falling a further 14.87% over the past 7 trading days. Ada, the cryptocurrency behind Cardano, is currently trading hands at a price of $0.12, at the time of writing and has experienced a 3.4% drop in price over the past 24 hours.
Cardano is being developed by previous Ethereum developer, Charles Hopkinson and is intended to become a smart contract platform that will be better than existing platforms. The Cardano blockchain is said to be able to handle thousands of transactions per second dwarfing the 25 transactions per second currently achievable by Ethereum.
Cardano is currently ranked at 8th in terms of overall market cap across the entire industry with a total market cap of $3.26 billion. Over the past 30 trading days Cardano has dropped by a total of 26.46%.
Let us continue to analyse price action for Cardano over the short term.
Price Analysis
ADA/USD – SHORT TERM – DAILY CHART
https://www.tradingview.com/x/VpMDUdEn/
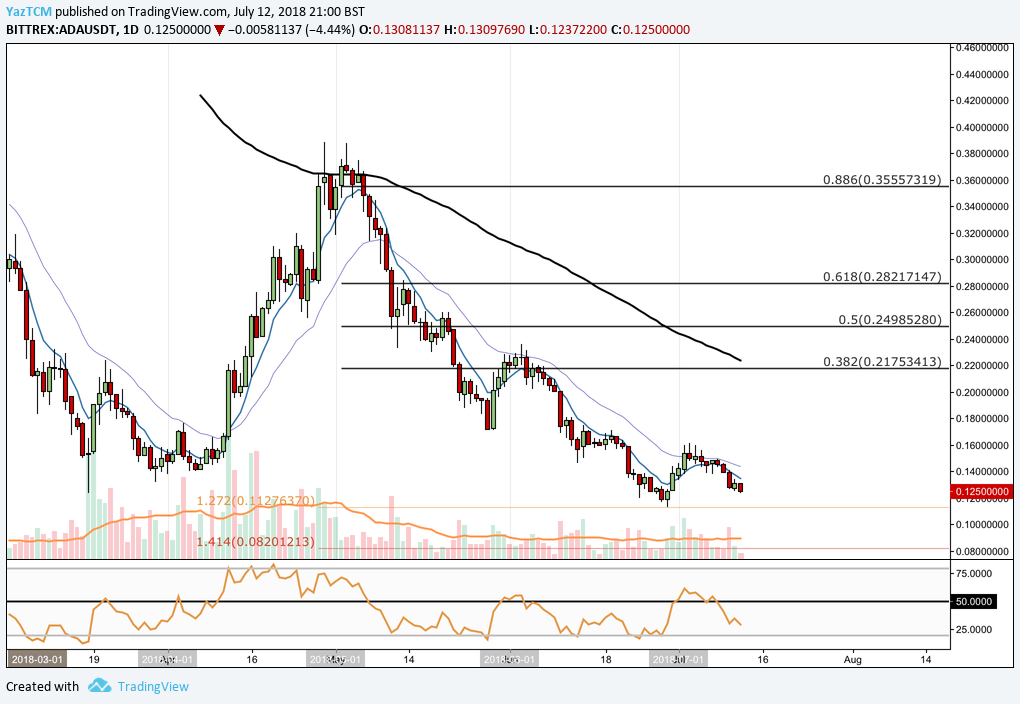
Analysing the market from the chart above, we can see that Ada had experienced a bullish run during April when price action rose from a low of $0.14 on the 6th of April to a high of $0.38 on the 29th of April. This was a price increase of 170% from low to high.
After placing this high, price action went on to depreciate throughout the following months and eventually fell to levels below the $0.14 starting handle described above. Cardano is currently trading at $0.12. We can see that the market had recently found a form of support at a 1.272 Fibonacci Extension priced at $0.11. This is a Fibonacci Extension taken from the entire bearish leg seen throughout May.
If the bearish pressure witnessed over the previous two months continues, we can expect Ada to head toward support back at the 1.272 Fibonacci Extension. If the market push prices further below this level, then further support is located at $10, followed by the 1.414 Fibonacci Extension located at $0.08.
Alternatively, if the market manages to garner bullish momentum from this area near term resistance will come in at July’s high priced at $0.16. If the market can continue past this level, then further resistance can be expected at the bearish .382 Fibonacci Retracement priced at $0.21. This is a Fibonacci Retracement taken from the entire bullish run seen through May and June. It is also important to note that the 100 day moving average is also located within this location adding to the expected resistance in this area.
The technical indicators are largely leaning toward the bears as witnessed by the bearish pressure within the market. The RSI is trading well below the 50 handle and is heading toward oversold conditions. For the market to turn bullish, we would expect the RSI indicator to make its way back above the 50 handle.
Let us continue to analyse ADA’s market action relative to Bitcoin over the recent period.
ADA/BTC – SHORT TERM – DAILY CHART
https://www.tradingview.com/x/Q0GT11eC/
 Analysing Ada’s performance against Bitcoin over the recent period above, we can see that Ada had appreciated against Bitcoin when it rose from a low of 1173 SATS on the 18th of March and extended all the way to a high of 4184 SATS on the 3rd of May. This was a price increase of 145% from low to high.
Price action is currently trading at support located at the .886 Fibonacci Retracement priced at 1962 SATS. This is a Fibonacci Retracement taken from the bullish run described above.
If the market can continue to hold at the .886 Fibonacci Retracement and begin a bullish run, then we can expect near term resistance to come in at the .786 Fibonacci Retracement located around 2278 SATS, this is also close to July’s price high. Further resistance can be located at the .618 Fibonacci Retracement priced at 2633 SATS.
Alternatively, if the market falls below the .886 Fibonacci Retracement then near term support can be found toward the lows seen in March priced at 1677 SATS.
The technical indicators are also largely favouring the bears within this market. The RSI is trading well below the 50 handle indicating that bears are in control of the market. If we want to see the bearish pressure seen recently within the market to subside, then we would like to see the RSI make its way back toward the 50 handle.


