

BitTorrent (BTT – USD)
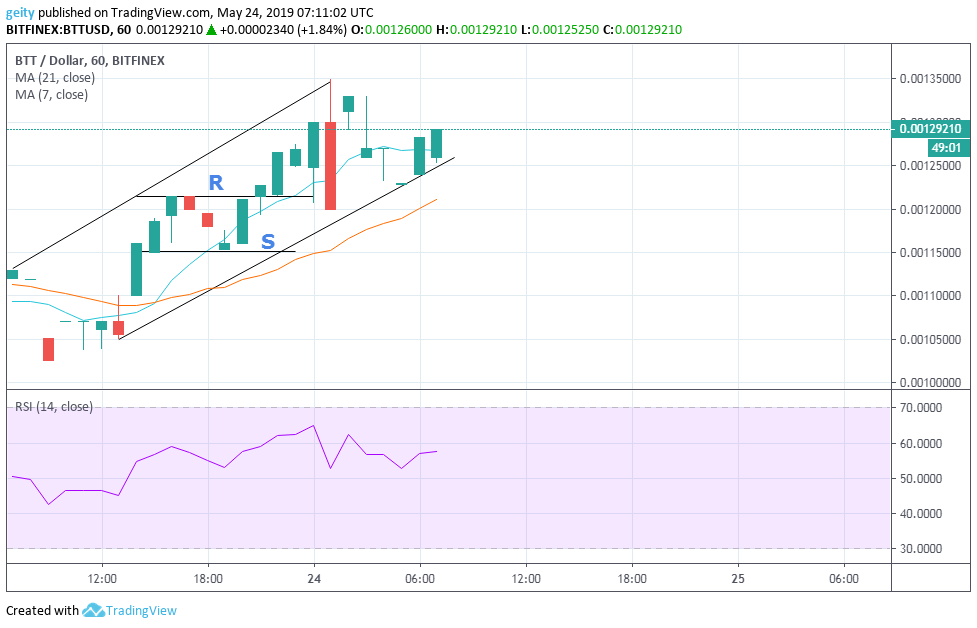
BTT began the day trading at $0.00113034. Between 23rd May ’19 at around 07:00 and 13:00 a declining price action was seen, this is confirmed by the 21-day MA that is seen above the 7 day MA indicating a bearish signal.
At that period of time presence of doji candles like the 4 price Doji is encountered signifying ultimate in indecision in the market.
The RSI is seen bellow 50 reflecting strong selling pressure at that period of time.
Later on, a bullish market rally is signalled by the 7 day MA that crossed over the 21-day. Ascending channel is observed due to the presence of a bullish regular divergence pattern that was signalled simultaneously.

The important significance level is placed at $0.00121448 as a resistance level and at $0.00115109 at the support level. From the beginning of the uptrend 23rd May ’19 at 14:00 to 24th May ’19 at 08:00 the RSI is above 50 this shows a strong buying pressure at that period of time.
BTT/USD pair is currently trading at $0.00129210, this shows that the price has slightly increased. This may be due to the fact that BTT has powered the BitTorrent speed platform that improved BitTorrent protocol for all users and torrent clients.
FORECAST
The 7-day MA has bent sideways during the last few hours; this shows the possibility of sideways price performance in the next few hours. New support level should be placed at $0.00123868.
TRON (TRX – USD)
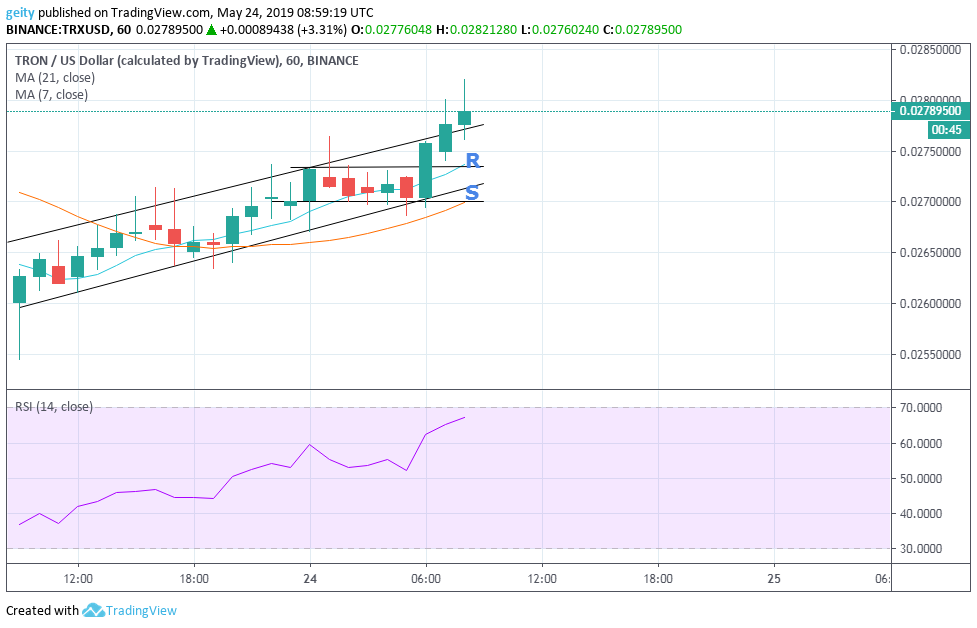
A bullish outlook is seen in the last 24hrs, this is buttressed by the ascending channel and the repeated appearance of the bullish regular divergence pattern. Increase price action is confirmed by the RSI which is trending upward indicating strong buying pressure. TRX began its day trading at $0.02626140; this was then followed by a sideways price action inside an ascending channel.
The regular appearance of Doji candles is encountered signifying equality and indecision in the market momentum. Slightly dip in price is observed at around 23rd May ’19 from 15:00 to 19:00 which was signalled by the 21-day MA that crossed over the 7-day MA, TRX price dropped from $0.2669474 to $0.2658503.
Later on, a period of consolidation is seen between 24 May ’19 from 00:00 and 06:00 placing resistance level at $0.02734981 and support level at $0.02700461.
This resulted in the formation of a marubozu candle, indicating that the bulls were in control at that period of time, thus pushing the price up to the current price $0.02789500. A possible reason for the increase of TRX price may be due to the partnership of TRX with Skypeople to launch a new blockchain game.
FORECAST
An uptrend is more likely to continue since the 7 day MA is still above the 21-day MA which indicates a bullish signal. The RSI is heading north indicating the possibility of an upward price rally in the next few hours. New target should be set at $0.02780350 and stop-loss to be placed slightly below the target in case of a breakdown.

