

BTC/USD
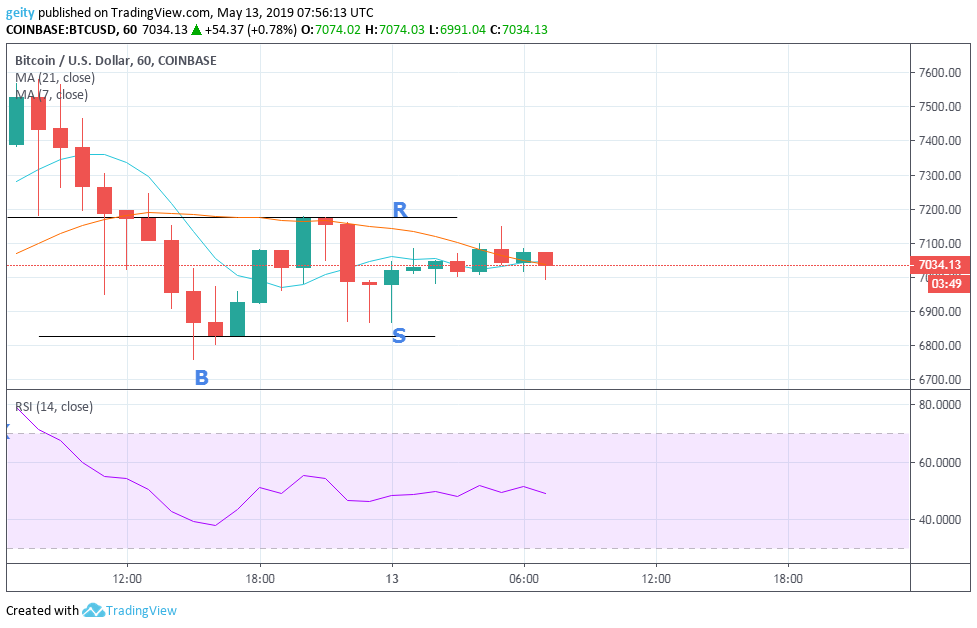
A bearish run is seen at the beginning of the day where price rally was pushed down past resistance (R) to a low of $6759.83 (B).
This was signaled by the 21 day MA crossing over the 7 day MA indicating a bearish signal, placing resistance levels at $7175.60 and support level is at $6826.57 (S). The support level was twice tested and later breached pushing the price momentum to a high of $7175.60.Stop –loss should be placed slightly below the support or resistance level before placing an entry.
A bearish engulfing pattern followed that pushed the price rally down. Later on, lack of momentum in the market was observed resulting in the consolidation of prices.
FORECAST

The relative strength index is seen between 70 and 30 this indicate that a sideways trend is likely to be seen in the next few hours. During the last few hours, the 7-day MA seems to be crossing over the 21 day MA indicating the coming of strong bullish momentum. New target should be placed at $7690.08.
XRP/USD
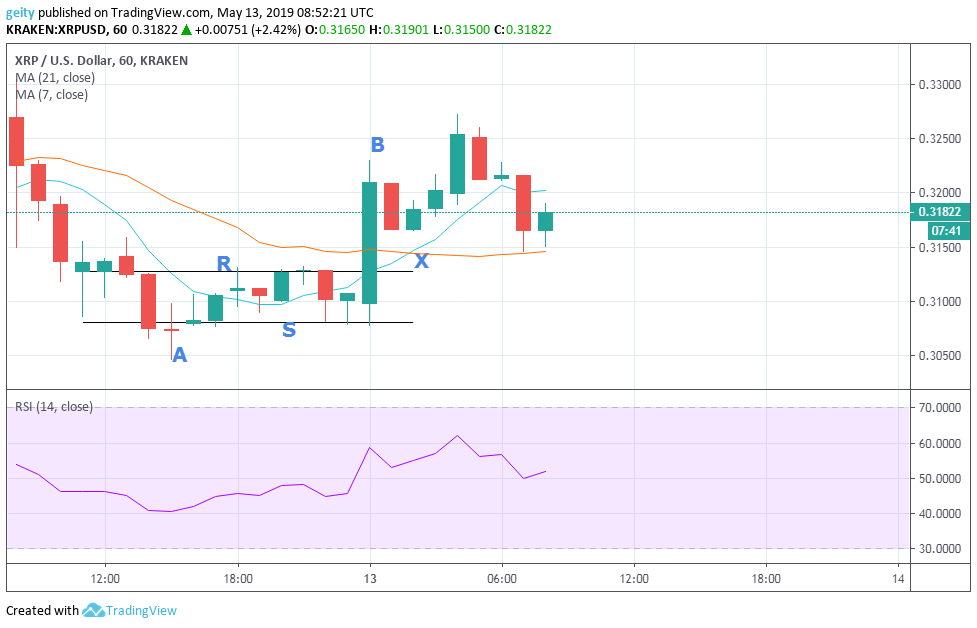
The day began with a downtrend; this was confirmed with a bearish outlook that pulled the price down to a low of $0.30454.
A sideways price momentum followed, later on, resulting in the formation of a horizontal channel due to the indecision of the market during that period of time. This placed resistance level (R) at $0.31276 and support level (S) at $0.30808. After a few hours, the price rally was shifted up past resistance level to a high of $0.32300 (B).
The 7-day MA crossed over the 21 day MA (X) which further pushed the price up to a high of $0.32725. XRPUSD pair started trading at $0.31930 and is currently trading at $0.3242.
FORECAST
The relative strength index is seen between 70 and 30 which indicates the presence of a ranging market. The RSI is also pointing north during the last hour indicating a bullish signal in the next few hours. New support should be placed at $0.32849.
ADA/USD
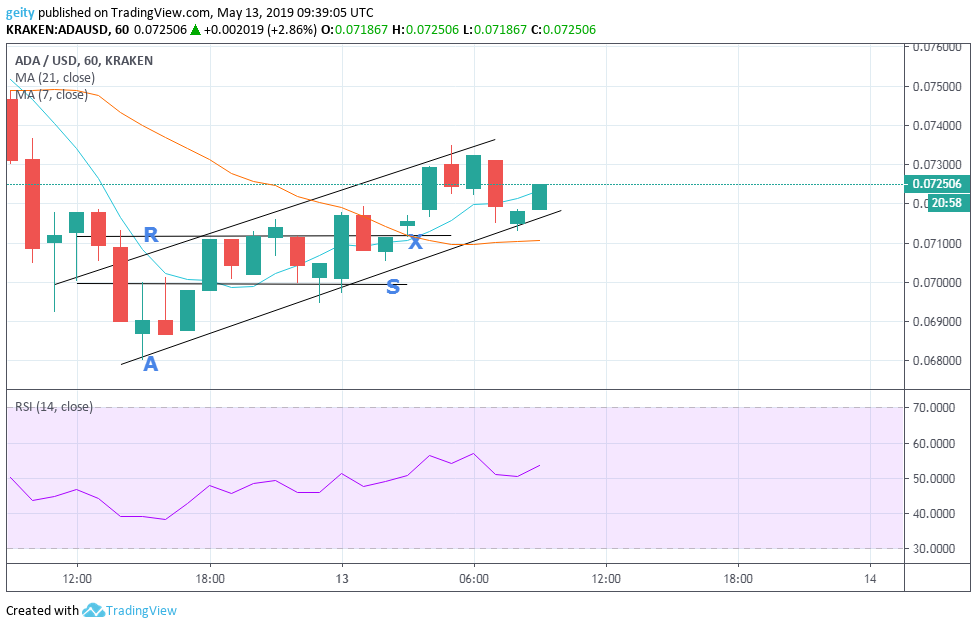
The day began with a bearish outlook that led to a dip in price momentum to a low of $0.0680 (A). An uptrend followed later during the day, leading to the formation of the ascending channel. The resistance level is seen at $0.0721 and support level is seen at $0.0699.
At (X) the 7 day MA is seen to be above the 21 day MA indicating a bullish signal, where price rally breached resistance and moved further up to close at the current trading price $0.0739. An upward price rally is observed thus buyers have the upper hand.
FORECAST
An uptrend is likely to continue in the next few hours. This is confirmed by the RSI which is heading north and the fact that the 7 day MA is still above the 21 day MA thus indicating bullish momentum. New support level can be placed at $0.07155 and traders should also trade in the direction of a breakout or breakdown.


