
 sees Massive Increase In Price")
Resistance levels: $4,144, $4,254, $4,385
Support levels: $4,044, $3,903, $3,774
BTC/USD Long-term Trend: Bearish
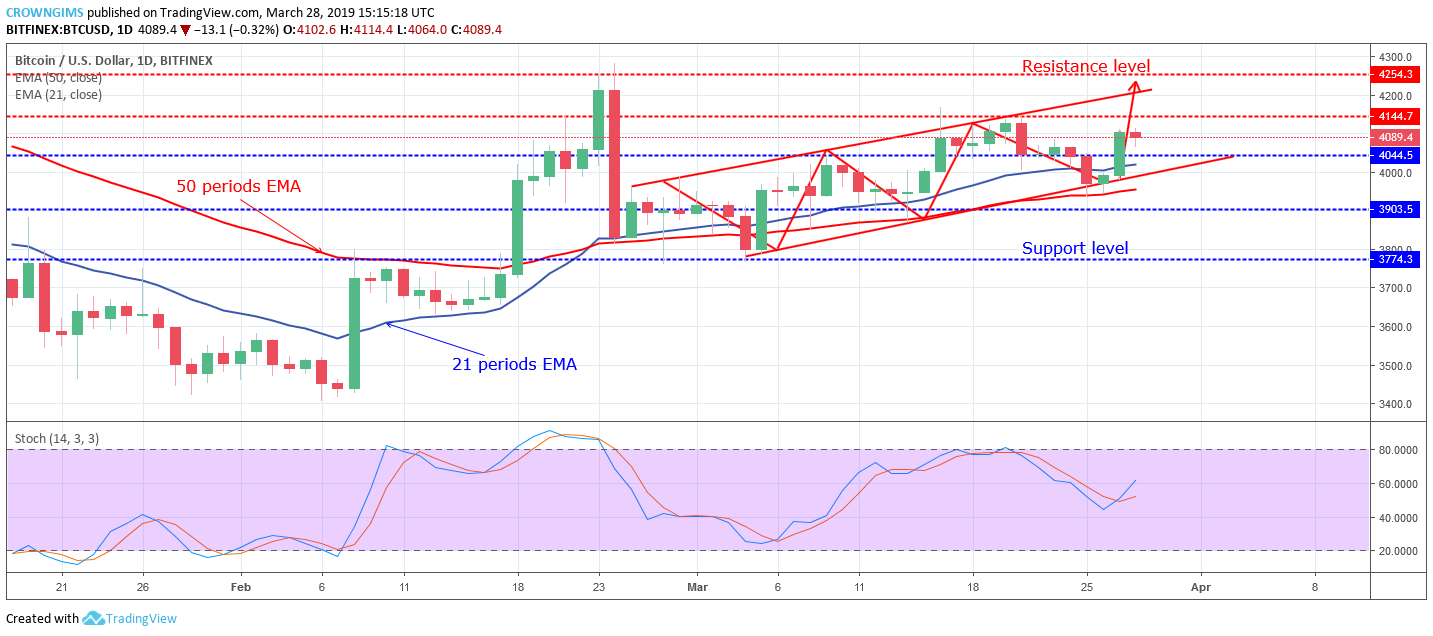
BTC/USD is on the bullish movement on the long-term outlook. The bullish momentum topped the cryptocurrency at the resistance level of $4,092. The Bears rejected further increase in the BTC price with the formation of strong and massive bearish candle that pushed the BTC price from the level of $4,092 down to the $4, 074 after downward penetration of the $4,144 and $4,044 levels.
Shortly after that, the coin was moving up in a zigzag pattern that led to the formation of a rising wedge pattern on the daily chart. Currently, the coin is heading towards the upper trend line at the resistance level of $4,254.

The two EMAs are directly placed below the BTC price and the 21 periods EMA is above the 50 periods EMA as an indication of a bullish trend. The Stochastic Oscillator period 14 is at 60 levels with the signal lines point up to indicate buy signal.
There is a possibility that the BTC price will reach $4,254 resistance level as the strong bullish daily candle emerged from the lower trend line of the rising wedge. In case the $4,254 resistance level holds, the price will bounce back to the lower trend line.
BTC/USD Medium-term Trend: Bullish
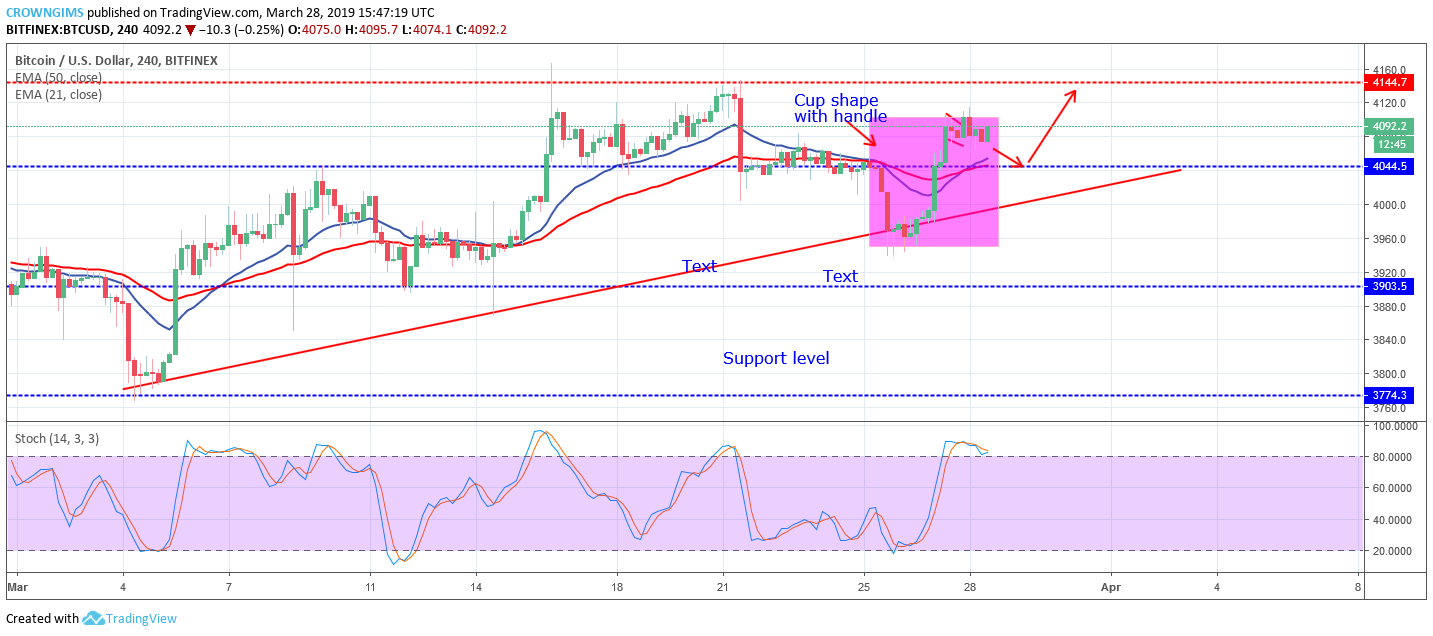
BTC is on the bullish trend on the Medium-term outlook. After the bearish momentum that pushed the coin down to the demand level of $4,044 from 44,144 resistance level, the coin consolidated for a few days.
The Bears further pushed the BTC price down towards $3,903 before it was supported at $3,900 zone and the bulls propelled the BTC price towards $4,044 price level to form a cup shape with handle pattern.
Currently, the handle of the cup is completing which is seen on the chart like pullback. Meanwhile, the Stochastic Oscillator period 14 is above 80 levels (overbought zone) with the signal lines point down to indicate sell which may be pullback before the continuation of the uptrend. There is a possibility that the coin will reach a high of $4,144 price level on the 4-hour chart.


