

Besides from a Tether caused price spike, the cryptocurrency markets have been relatively stagnant during the month of October 2018. The total market cap of the entire industry is currently valued at around $209 billion, at the time of writing, falling a small $16 billion from the market cap peak of $225 billion seen in early October 2018.
The majority of the cryptocurrencies within this list are trading within triangular consolidation patterns indicating the indecision between bulls and bears as the market trades sideways.
It seems as though the cryptocurrency market is waiting on the upcoming decisions from the SEC regarding the approval of a Bitcoin ETF. The last ETF to be approved by the SEC was for copper but if a Bitcoin ETF was approved this would allow institutional money to flow into the cryptocurrency markets with a surge of volume and thereby increasing the market cap of the entire industry.
The much-publicized Bakkt exchange will also launch during December 2018 allowing for Wall Street type players to enter the industry through an exchange that is backed by the owners of the New York Stock Exchange. The Bakkt exchange will also offer a custody service which will allow Wall Street type traders to be able to trust the security of their cryptocurrency to the Bakkt custodian service.
Let us continue to analyze price action for BTC, ETH, XRP, XLM, and TRX to assess market behavior and highlight any potential support and resistance areas to watch out for in the weeks ahead.

Price Analysis
Bitcoin (BTC)
BTC/USD – SHORT TERM – DAILY CHART
https://www.tradingview.com/x/RziZgkkg/
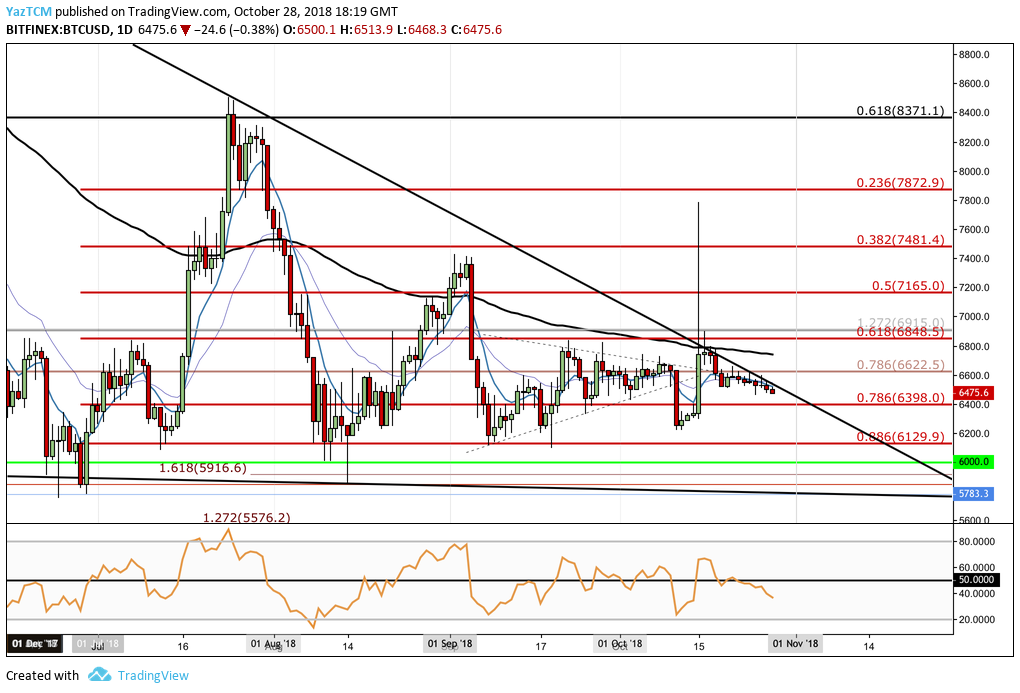
Bitcoin has continued to remain within the confines of the descending triangle pattern that it has been confined within since early January 2018.
The market has seen a small 1.54% drop in the past 24 hours of trading. The cryptocurrency is currently exchanging hands at a price of around $64772 after seeing a relatively stable 7 day trading period where the market only move -0.73%.
Bitcoin is still the number 1 ranked cryptocurrency as it currently holds a market cap value of around $112 billion. The 66-month-old coin has suffered a precipitous downtrend totaling -14% over the past 90 trading days and is still trading at a price that is 66% lower than the all-time high price.
We can see that price action had experienced a significant price surge when the market started at a low of $5780 on the 29th of June 2018 and extended to a high of $8506 on the 24th of July 2018. This was a total price increase totaling 47% from low to high.
Price action has been trading in a sideways/consolidating manner since rolling over at the high. We can see that price action has remained contained within the long-term descending triangle pattern trading along the upper boundary of the triangle for the past week or so.
Moving forward in the week ahead, the bearish action is likely to continue until price action can break up above the upper boundary of the descending triangle. If the bearish action persists to push price action lower we can expect immediate support below to be located at the 786 Fibonacci Retracement level priced at $6398. Further support below this can be located at the .886 Fibonacci Retracement level priced at $6129 followed by the psychological support at the $6000 barrier.
If price action does break above the upper boundary we can expect immediate resistance above at the long term .786 Fibonacci Retracement level priced at $6622 followed by the short-term .618 Fibonacci Retracement level priced at $6848.
The RSI is printing a reading that favors the bears at this moment in time. If we would like to see price action increase, we would need to see RSI break above the 50 handles to indicate that the bulls are now in possession of the momentum within the market.
Ethereum (ETH)
ETH/USD – SHORT TERM – DAILY CHART
https://www.tradingview.com/x/R6oRQjo8/
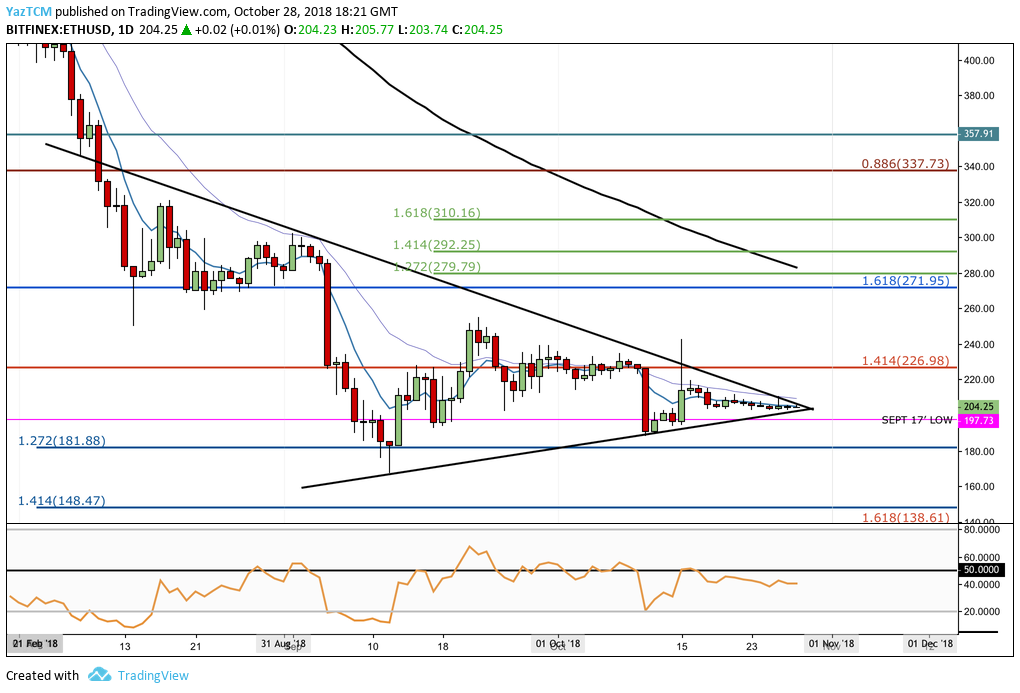
Ethereum has also been trading in a sideways/consolidation manner over the past 2 months of trading. We can clearly see the well defined symmetrical triangle within the Ethereum market.
Ethereum is currently ranked in 2nd position in terms of the overall market cap with a total market cap value of around $20.99 billion. The cryptocurrency is currently trading hands around $204 after seeing a stable price week moving just -1% over the past 7 trading days.
The 39-month-old coin has seen a very rough 90 day trading period as the market loses -55%. Ethereum is now trading at a price that is -85% lower than the all-time high value.
Looking at the chart above, we can see that Ethereum is quickly approaching the apex of the symmetrical triangle. Typically a symmetrical triangle will breakout in the direction of the previous trend, in this case, bearish. However, it is still possible to break toward the upside if enough bullish momentum enters the market.
Moving forward in the week ahead, in the case that the bears push price action below the lower boundary of the triangle, we can expect immediate support below to be located at the psychological round number handle at $200 followed by the September 2017 low at $197.73.
If the bears persist to push price action further lower we will see more support below at the downside 1.272 and 1.414 Fibonacci Extension levels priced at $181 and $148, respectively.
Alternatively, if the bulls regather momentum and push price action above the upper boundary of the triangle we can expect immediate resistance above to be located at the red 1.414 Fibonacci Extension level priced at $226 followed by the previous 1.618 Fibonacci Extension level (drawn in blue) priced at $271.95.
It is important to highlight that due to the low volume within the market price action may just break out of the confines of the triangle and continue to trade sideways. In this case we would need to adjust the triangle boundaries and remain patient until the market shows that more volume is entering.
Ripple (XRP)
https://www.tradingview.com/x/CuK8WhSA/
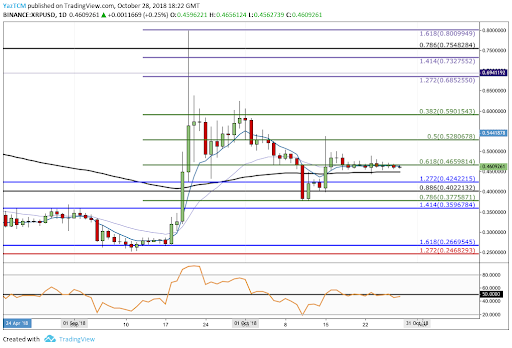
XRP has also managed to continue to hold a lot of its value from the bullish rally seen after the PNC Bank partnership. The market is trading marginally below the $0.50 handle as it trades comfortably at the $0.4659 handle.
Ripple’s XRP is ranked 3rd in the market cap rankings as it currently holds $18.44 billion market cap value. It has also had a very stable week previously moving a cool 0% either way. The 63-month-old coin has suffered a turbulent 30 day period after the bullish rally, losing a total of 13.72%. Ripple is now trading at a value that is 87% lower than its all-time high price.
Looking at the chart above we can see XRP had seen a price surge when the market started at a low of $0.2684 on the 18th of September 2018 and extended to a high of $0.7978 on the 21st of September 2018. This was a price increase totaling 200% from low to high.
Price action has since retraced to find further support at the short term .786 Fibonacci Retracement level priced at $0.37758. The market is now trading in the short term .618 Fibonacci Retracement level priced at $0.4659 and has been very stable at this level over the past 12 trading days.
Moving forward in the week ahead, if the bullish momentum can push price action higher away from the .618 Fibonacci Retracement level and up above the psychological round number handle at $0.50 we can expect immediate resistance above to be located at the .5 and .382 Fibonacci Retracement levels priced at $0.5280 and $0.5901, respectively.
Alternatively, if the bears pressure price action lower we can expect immediate support below to be located at the long-term .886 Fibonacci Retracement level priced at $0.40 followed by the short-term .786 Fibonacci Retracement level priced at $0.3775.
Stellar (XLM)
https://www.tradingview.com/x/I3L0ao1q/
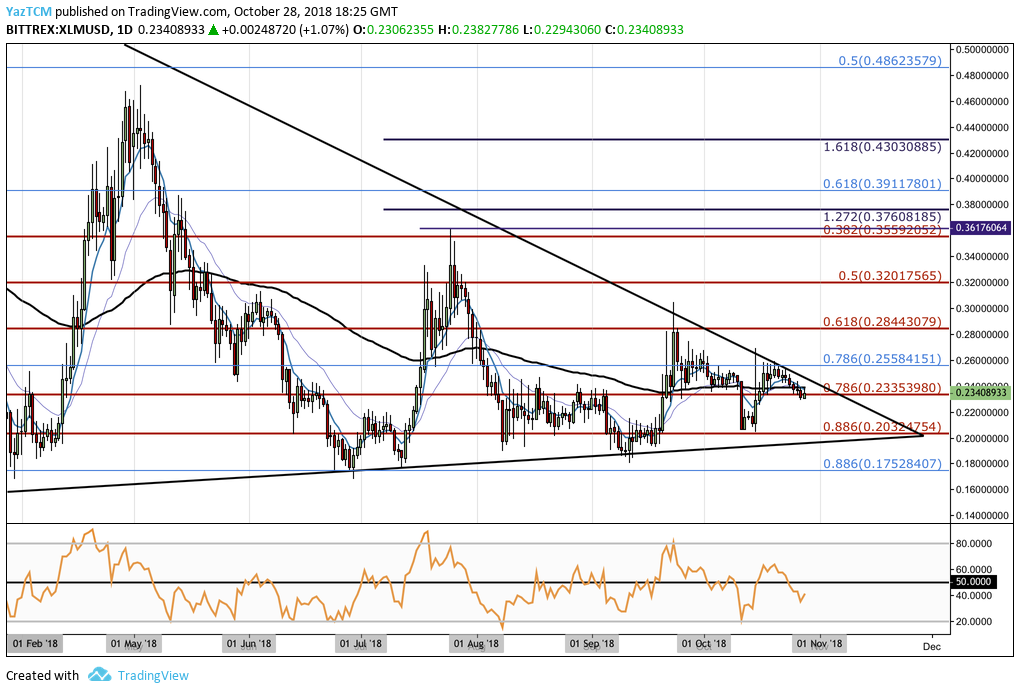
Like the majority of cryptocurrencies on this list, Stellar is also trading within the confines of a symmetrical triangle pattern. Price action is also approaching the apex in this market where a breakout is expected.
Stellar currently holds a market cap value of around $4.37 billion which puts it in 5th position in terms of overall market cap rankings. The market has seen a -4.33% price drop over the past 7 trading days at the market now trades around the $0.02340 handle. The 51-month-old coin has seen a 21% price decline over the past 90 trading days as it trades at a value that is -72% from all-time high price,
We can see that price action is now trading at the support provided by the short-term .786 Fibonacci Retracement level priced at $0.2335. If the bears continue to push price action lower further support below can be expected at the $0.02300 psychological round number handle followed by the .886 Fibonacci Retracement level priced at $0.2032. IF the bears continue further lower then further support beneath will be located at the lower boundary of the symmetrical triangle pattern.
On the other hand, if the bulls can regroup their efforts and push price action higher above the triangle, they will meet further resistance above at the .618 and .5 Fibonacci Retracement levels priced at $0.3201 and $0.3559, respectively.
Tron
https://www.tradingview.com/x/HdiMeVSG/
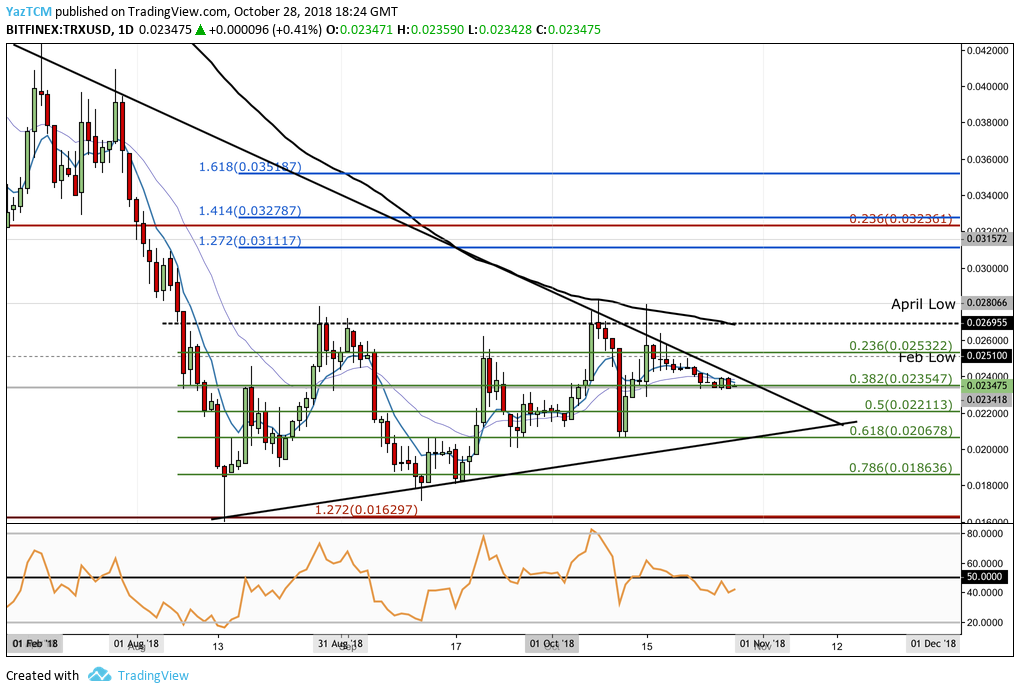
Analyzing Tron from the short term perspective above, we can see that the market has also been trading sideways as the upside is limited until price action can break up above the April low price at $0.0280. We can also see that price action has been forming a symmetrical triangle pattern that price action has been confined within for over 3 months.
Tron is currently ranked in 11th position with a total market cap value of $1.55 billion. The cryptocurrency has seen a small 7-day price drop totaling -3.27% as the crypto trades at a price around $0.02347. The 13-month-old coin has seen a rough -32% drop over the past 90 trading days and is trading at a price that is 90% lower than the all-time high value.
We can see that the market had seen a recent price surge starting from a low of $0.016 on the 14th of August 2018 and extending to a high of $0.02787 on the 28th of August 2018. This was a price increase totaling 73% from low to high.
The market is now trading in the short term .382 Fibonacci Retracement level priced at $0.02357 where relatively strong support has been found. Price action has been struggling to break up above the upper boundary of the triangle during the entirety of October 2018 which may show the sign that the market may be heading further lower before breaking up out of the consolidation pattern.
Moving forward, if the bears pressure price action below the support at $0.02357 we can expect further support below to be located at the .5 and .618 Fibonacci Extension levels priced at $0.02211 and $0.02067. Further support below can then be located at the lower boundary of the symmetrical triangle pattern.
Alternatively, in the bullish scenario, if the bulls can break up above the confines of the triangle they will meet immediate resistance above at the April 2018 price low at $0.28066. Bulls must break above this to be able to confirm that a bullish trend is forming.


