

BITCOIN (BTC-USD)
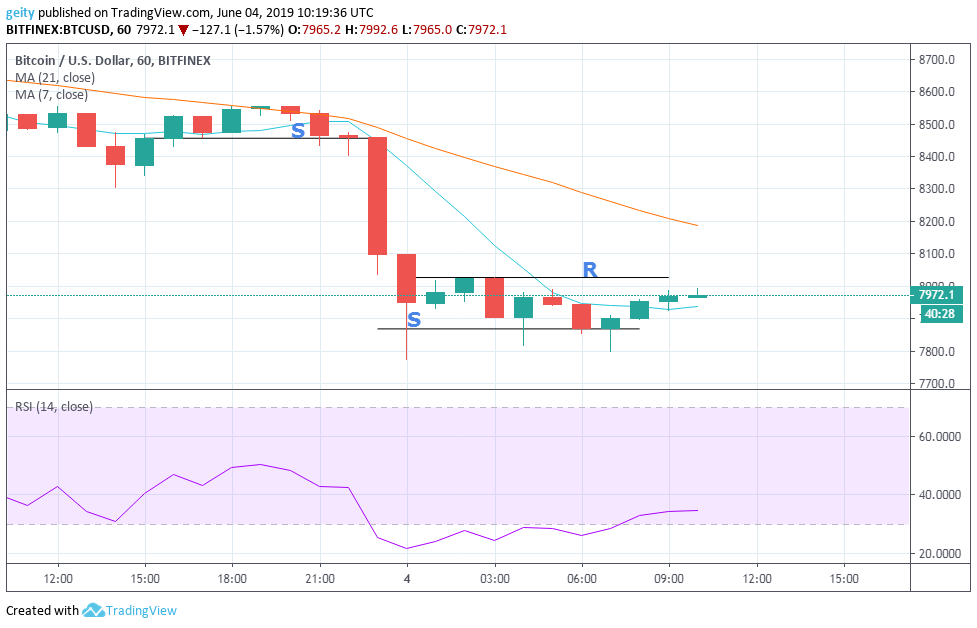
General bearish momentum is seen in the last 24hrs, is therefore confirmed by the 21 day MA that is seen above the 7 day MA indicating a bearish signal.
A strong selling pressure is also encountered which is buttressed by the RSI that is seen below level 50. BTC/USD pair began the day trading at $8487.0 at around 03rd Jun 11:00, against the current price of $7972.1.
This was later followed by a short-term period of consolidation that reflecting luck of momentum in the market, which took a stop at around 03rd June 22:00.
Later on at 23:00 the same day, a strong selling pressure seen results to formation of a bearish engulfing candle that dips the price momentum to a low of $7770.0.

Resistance level is thereby stood at $8027.1 and support level at $7869.1. A period of consolidation is seen later on thus placing BTC to its current price of $7972.1. BTC price has dip by 6.07%; this may be as a result of miners shutting down their operations due to high power consumption, market manipulation or even high cost of mining.
FORECAST
A bullish outlook is likely to be seen this is therefore reflected by the RSI that is trading upward during the last few hours. New target should be stood at $7921.0.
ETHEREUM (ETH-USD)
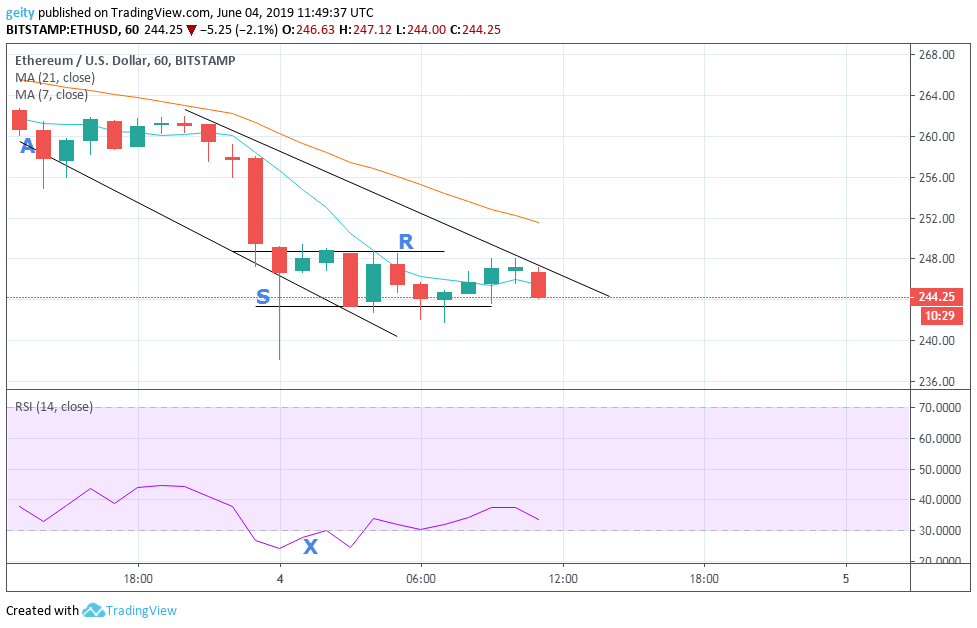
Just like BTC/USD pair, ETH/ USD pair is trading on a downtrend channel with a bearish outlook. The 21 day MA is seen above the 7 day MA thus indicating a bearish momentum. Strong selling pressure is also reflected by the RSI since is observed trading below level 50. This clearly shows that the bears are in control, and that the asset luck confidence from investors. The day began with a period of consolidation with ETH trading value being at $260.69.
At around 3rd June as at 22:00 presence of a Doji is observed indicating indecision in the market. Later on, the bears took control and further dipped the price performance further down to a low of $238.00.
The RSI X is encountered below level 30 indicating an oversold market at that period of time. The significance level were therefore stood at, resistance level at $248.74 and support level at $243.34. ETH current price was brought to $244.25 with a dip of 6.3%.
This is due to bad management of asset /liability by the Initial Coin Offering (ICO), another reason may be due to the80,000 ETH that where transferred to the Kraken Exchange in two different transactions.
FORECAST
Further downtrend is likely to be seen since the RSI is still trading below level 50 and the 21 day MA is still above the 7day MA. New target should be placed at 244.90 and a stop-loss slightly above or below in case of a break out or breakdown.
XRP-USD
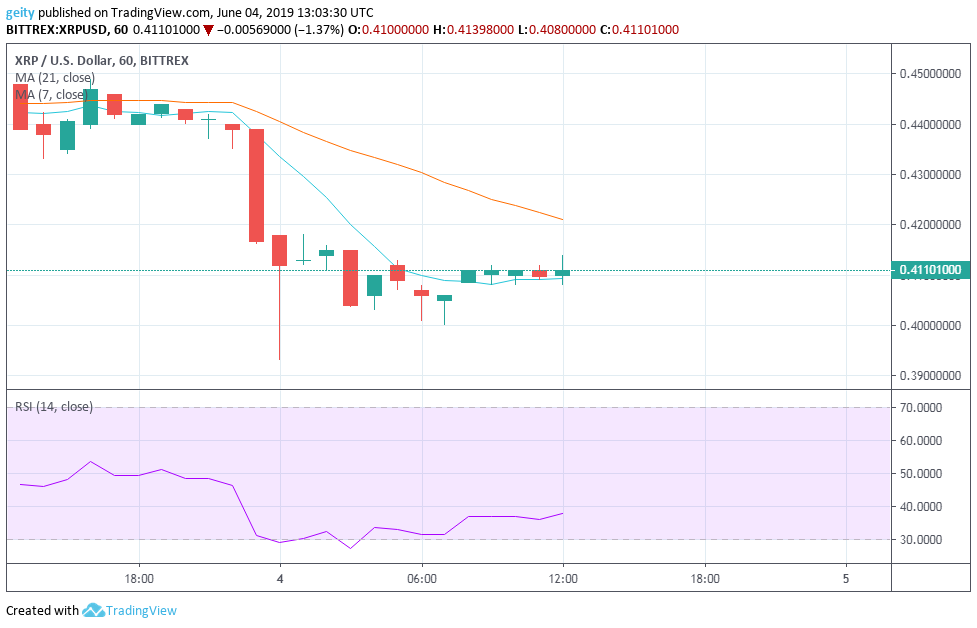
XRP is also exhibiting a downtrend outlook in the last 24 hrs. XRP began trading on 03rd June 13:00 at $0.43876 according to Bittrex. The 21 day MA is seen above the 7 day MA thus reflecting a bearish market momentum. A consolidation period is also seen twice, that is; at the beginning and at the end of the trend indicating luck of momentum in the market.
At around 4th June 0000h price action was dropped to an all-time low of $0.39297. The RSI is seen below level 30 at around 03:00 indicating strong selling pressure thus showing an oversold market.
XRP is currently trading at $0.411010, this shows that the asset has lost confidence from investors resulting in a decline in its value.
FORECAST
Bullish momentum is likely to be seen since the 7-day MA is seen trading sideways below the 21-day MA during the last few hours; this shows the possibility of an upward price rally. New target should be set at $0.41500 and stop-loss to be set slightly below in case of a breakdown.


